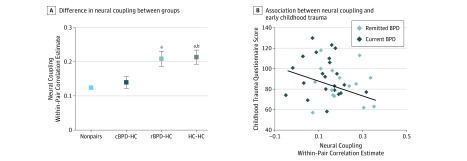
Figure 3. Neural Coupling in Borderline Personality Disorder (BPD).
A, Difference in neural coupling between groups, driven by significantly lower indices within current BPD–healthy control (cBPD-HC) pairs compared with remitted BPD–HC (rBPD-HC) pairs and HC-HC pairs. Bars represent mean values and whiskers represent SEM. B, Association between neural coupling and early childhood trauma in patients with BPD. A multiple regression analysis was used to generate the curve and the statistic that summarizes the association between the dependent and independent variables.
aP < .05 compared with cBPD-HC pairs.
bP = .88 compared with rBPD-HC pairs.

