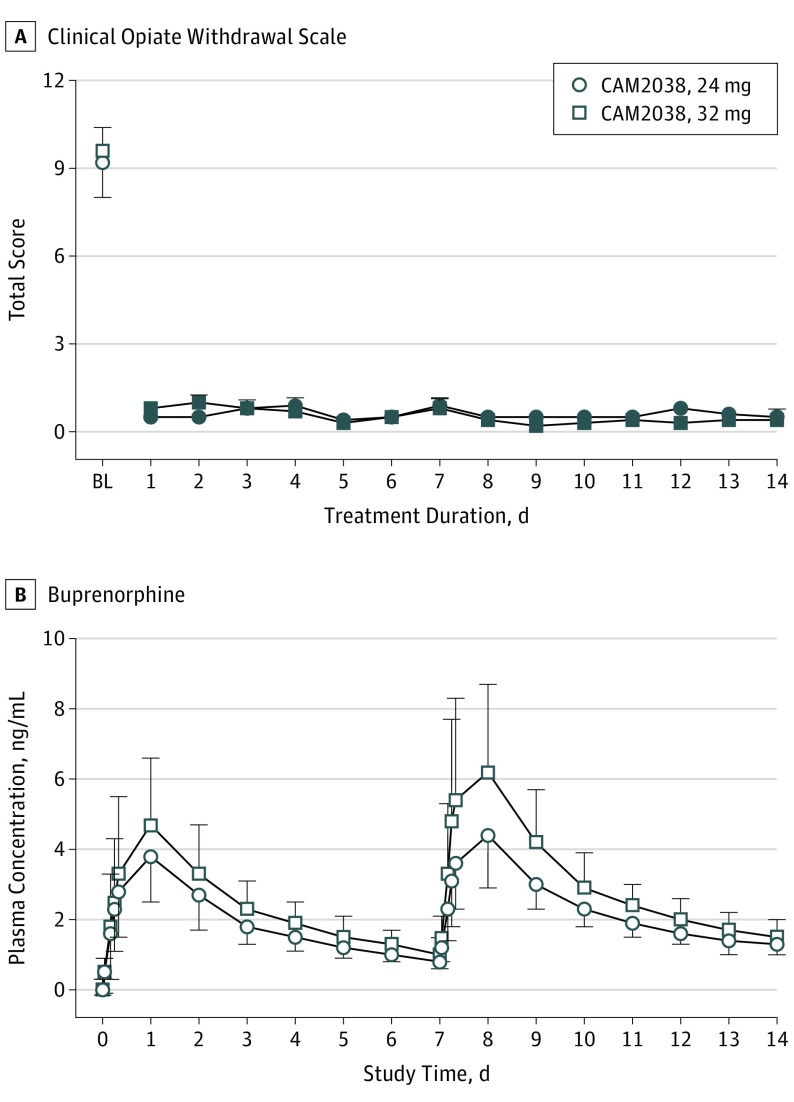
Figure 4. Clinical Opiate Withdrawal Scale and Buprenorphine Concentrations .
A, Mean (±1 SEM) Peak Ratings for the Clinical Opiate Withdrawal Scale for CAM2038, 24 mg and 32 mg are shown at baseline (ie, before CAM2038 injection) and each study day thereafter. CAM2038 injections were administered on day 0 and day 7. The repeated-measures model revealed a significant main effect of day (all P < .001) for the Clinical Opiate Withdrawal Scale (F14,294 = 39 for 24 mg and F14,322 = 78.4 for 32 mg). B, Graph shows the arithmetic mean (±1 SD) buprenorphine plasma concentrations for the cohorts over the course of the study. CAM2038, 24 mg: n = 22; 32 mg: n = 24.
aThe filled symbols indicate a significant difference from the baseline score (Tukey t test; P < .05).

