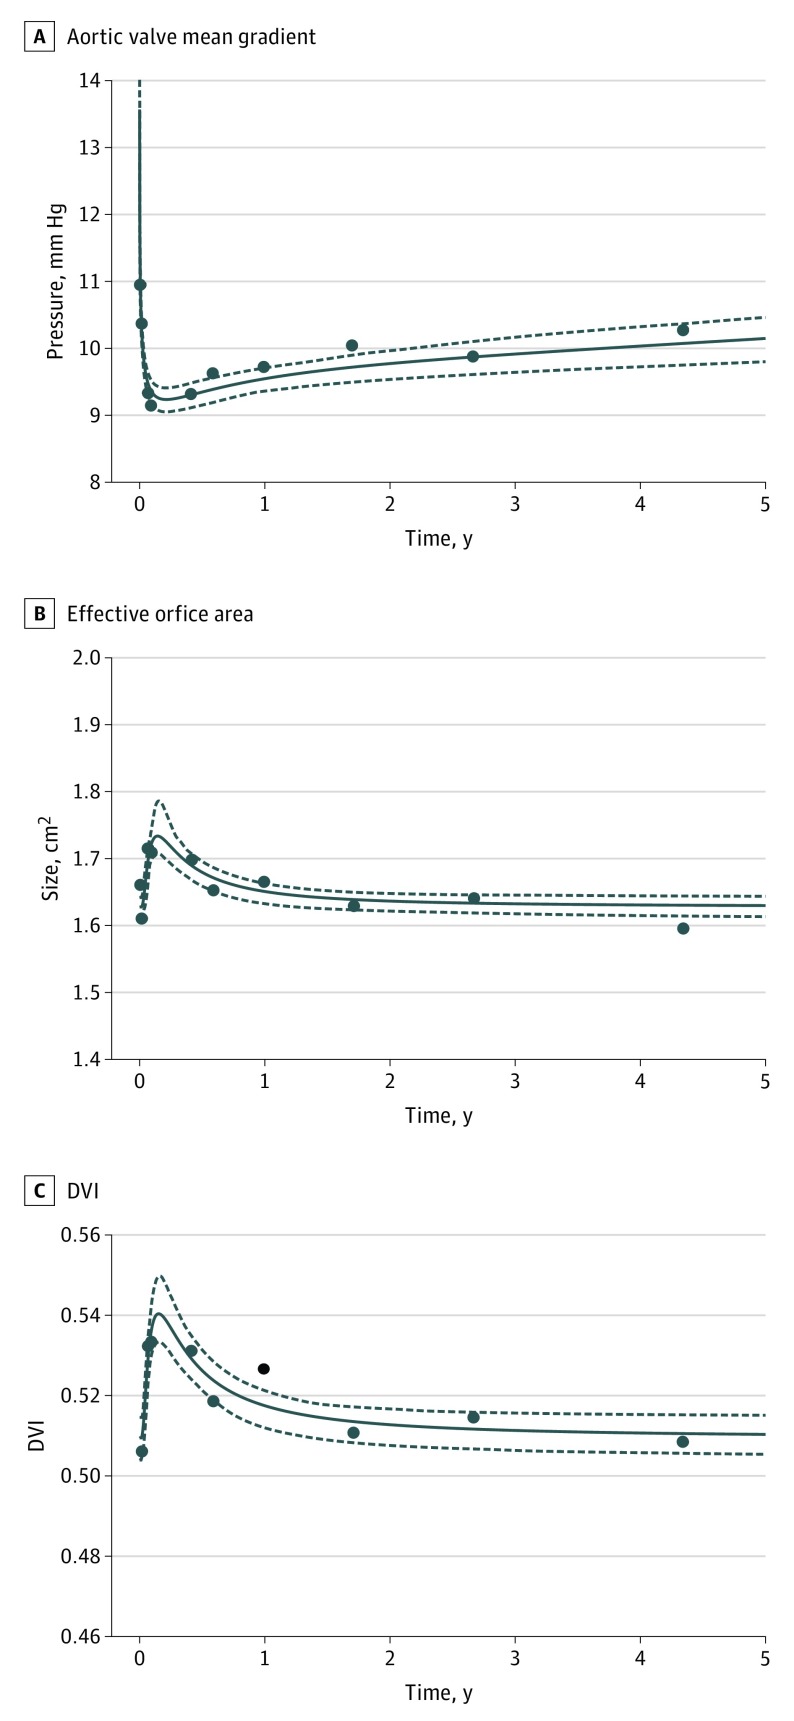
Figure 2. Temporal Trends in Transcatheter Aortic Valve Replacement.
Solid lines indicate the parametric estimate of the temporal trend after procedure; dotted lines indicate 95% CIs. Filled circles indicate grouped data without regard to the repeated measurements based on time intervals, provided here as a crude verification of the model fit. DVI indicates Doppler velocity index.

