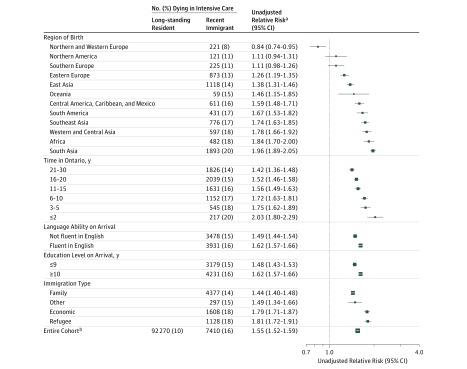
Figure 2. Proportion of Decedents Dying in Intensive Care: Recent Immigrant Characteristicsa.
Forest plot analogous to Figure 1 depicting the ratio of the proportions of decedents dying in intensive care units comparing recent immigrant with long-standing resident cohorts (relative risk). In contrast to Figure 1, this figure focuses on subgroups defined only among the recent immigrant cohort including region of origin, language ability on arrival, education level on arrival, immigration class, and time since immigration. The proportion of recent immigrant decedents dying in intensive care within each subgroup is compared with the proportion of long-standing resident decedents dying in intensive care (92 270 of 919 499 [10%]), and so a relative risk greater than 1 corresponds to an increased relative risk of recent immigrant compared with long-standing resident decedents being in the intensive care unit at death. Note that percentages are based on the size of each subgroup by row, not based on the overall analytic sample size for recent immigrant decedents of 47 514. The size of each square is proportional to the precision of the relative risk estimate.
aThe denominator data for the percentages are the total numbers of recent immigrant decedents in each subgroup, ie, the corresponding cells in eTable 3 in the Supplement.

