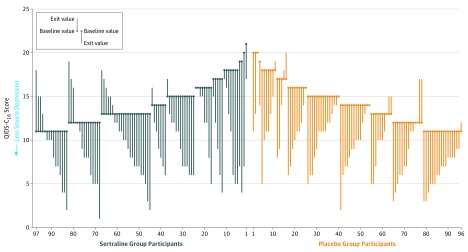
Figure 3. Paired Baseline and End of Study 16-Item Quick Inventory of Depressive Symptomatology–Clinician Rated (QIDS-C16) Scores.
Parallel line plot of the QIDS-C16 scores. Each patient is represented by a vertical line, with participants plotted by group assignment (sertraline, n = 97; placebo, n = 96) and sorted by baseline value.

