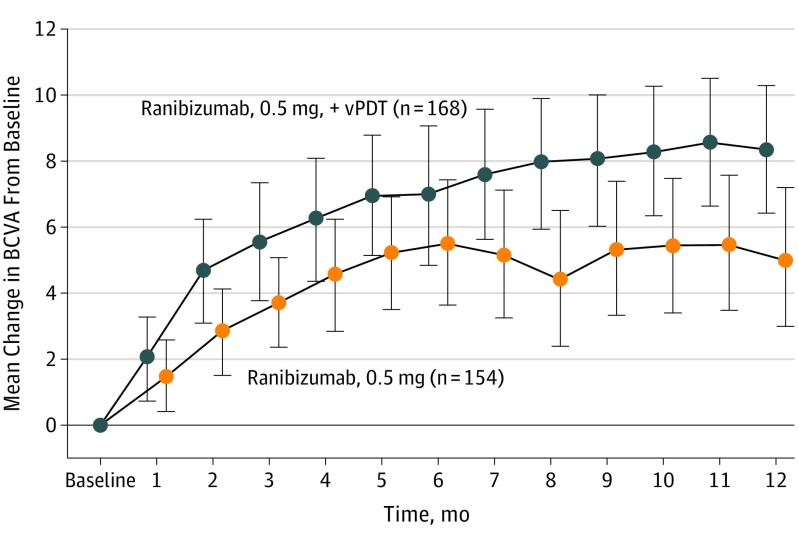
Figure 2. Mean Change in Best-Corrected Visual Acuity (BCVA) From Baseline to Month 12 (Full Analysis Set).
The total counts presented are the counts of patients in the specific treatment group who attended the specific visit. These total counts are used as the denominator for the percentages. Error bars represent 95% CIs. vPDT indicates verteporfin photodynamic therapy.

