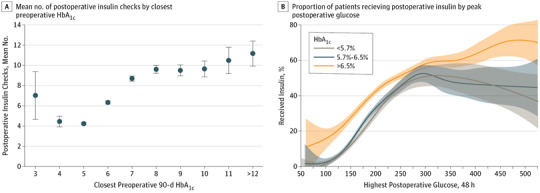
Figure 2. Postoperative Glucose Level Surveillance and Hyperglycemic Treatment.

A, Mean number of postoperative insulin checks by closest preoperative hemoglobin AIc (HbA1c). Error bar represents mean 95% CI. B, Proportion of patients receiving postoperative insulin by peak postoperative glucose level. The gray shaded area represents glucose levels less than 5.7%
