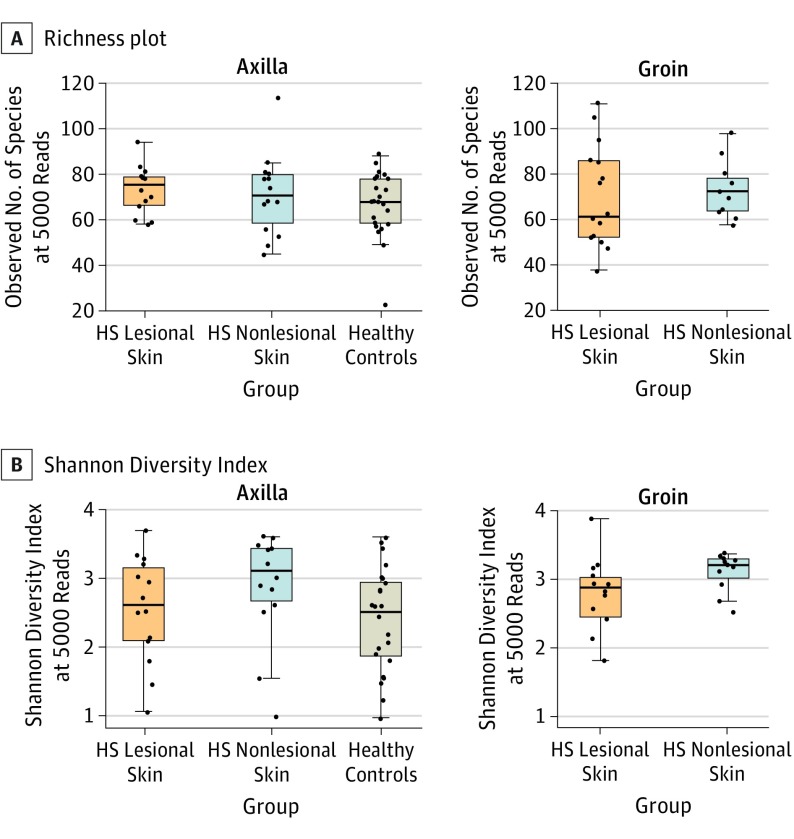
Figure 3. Richness Plot and Shannon Diversity Index.
A, Richness plot stratified by anatomical location shows no difference between the number of species per sample in the 3 groups (HS lesional skin median [IQR] 72 [59-82], HS nonlesional skin 72 [63-80], and healthy controls 68 [59-78], P = .66) after rarefaction to 5000 reads. No difference was found between the 2 anatomical locations (model comparison with vs without interaction term between group and location, P = .54). B, Shannon Diversity Index stratified by anatomical location shows the diversity of the species in each group. The index reveals an increased diversity in HS nonlesional skin (median [IQR] 3.21 [2.84-3.39]) compared with HS lesional skin and healthy controls (2.80 [2.14-3.09] and 2.52 [1.88-2.95], overall P = .005). No difference was found between the 2 anatomical locations (model comparison with vs without interaction terms between group and location, P = .91). HS indicates hidradenitis suppurativa.

