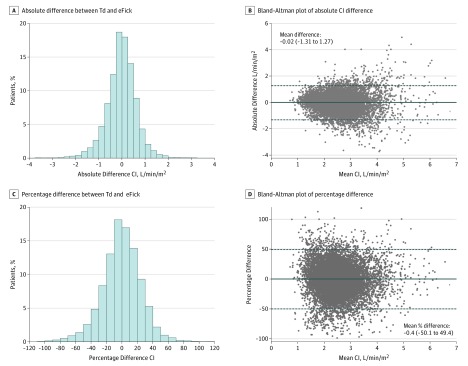
Figure 1. Distribution of Differences and Bland-Altman Analysis of Thermodilution (Td) vs Estimated Oxygen Uptake Fick (eFick) Cardiac Index (CI) Estimates in the Veterans Affairs Clinical Assessment, Reporting, and Tracking (VA CART) Cohort.
Shown are the proportions of patients with a given absolute difference between Td and eFick estimates (A). Shown is a Bland-Altman plot of the mean of the Td and eFick CI estimates on the x-axis against the difference (eFick minus Td) on the y-axis (B). Shown are the percentage differences between Td and eFick estimates (C).There was no substantial systematic difference between Td and eFick, but the 95% limits of agreement were wide (−1.31 to 1.27 L/min/m2, or −50.1% to 49.4%) (D).

