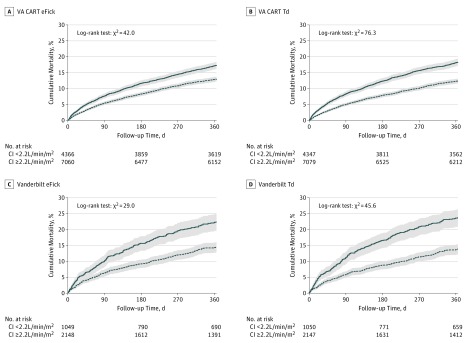
Figure 3. Cumulative Mortality Through 1-Year Follow-up, Stratified by Estimated Oxygen Uptake Fick (eFick) and Thermodilution (Td) Cardiac Index (CI).
Patients with low CI (<2.2 L/min/m2) in the VA cohort had a higher incidence of death than those with normal CI, whether estimated by eFick (A) or Td (B). However, the relative hazard for mortality and model fit was better for Td CI. C and D, Equivalent plots are presented for the Vanderbilt cohort, stratifying CI by lowest tertile vs second and third tertiles. The solid and dotted line in each plot represents the cumulative mortality for those with low and normal CI, respectively. Gray area reflects the 95% confidence interval.

