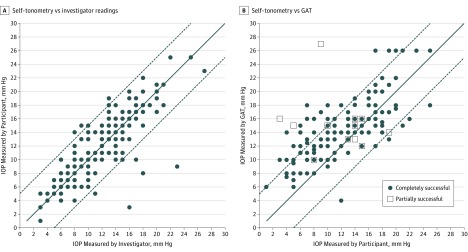
Figure. Participant and Investigator Icare HOME Readings and Goldmann Applanation Tonometry (GAT) .
A, Scatterplot of Icare HOME readings obtained by self-tonometry (successful and partially successful participants) and by the investigators. B, Scatterplot of Icare HOME readings obtained by self-tonometry vs GAT readings. The solid lines represent the reference line of perfect agreement and the dashed lines, 5 mm Hg limits of agreement. IOP indicates intraocular pressure.

