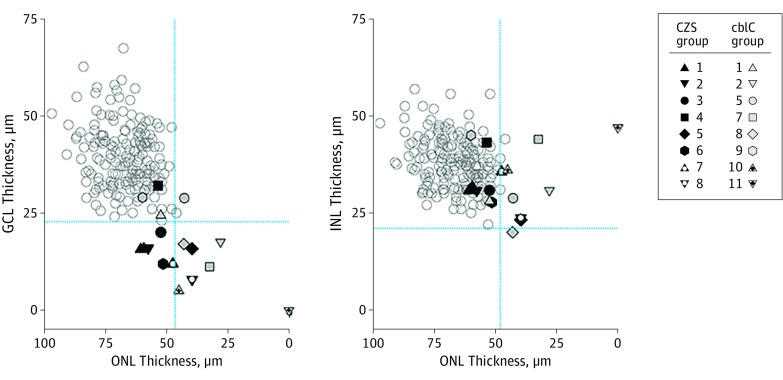
Figure 3. Quantitation of Nuclear Layer Thickness in Congenital Zika Syndrome (CZS).
Thicknesses of ganglion cell layer (GCL) and inner nuclear layer (INL) were plotted as a function of outer nuclear layer (ONL) thickness in all patients. Blue dotted lines indicate normal limits (normal mean [2 SDs] of 51 individuals aged 1-72 years). Gray unfilled symbols indicate data from health individuals. cblC indicates cobalamin C.

