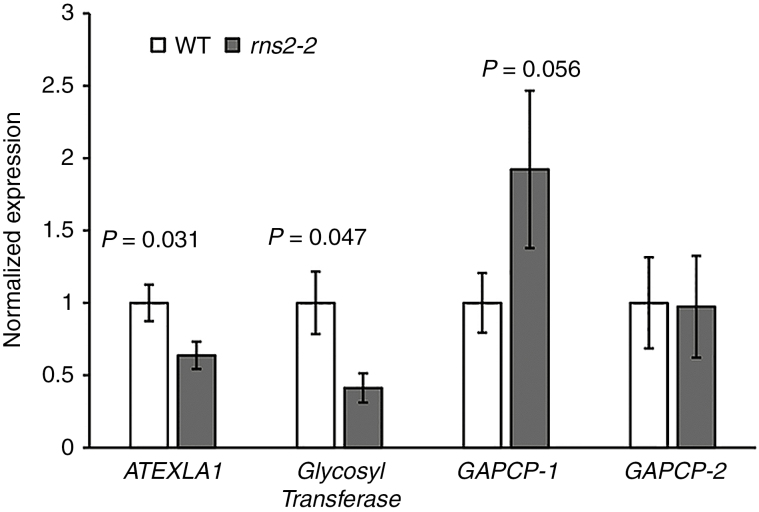
Fig. 1.
Verification of microarray results. Expression of genes identified as differentially expressed in the microarray analysis was analysed by quantitative RT-PCR (qPCR). RNA was extracted from WT and rns2-2 seedlings grown identically to the material used for transcriptome analysis. Genes selected for testing were ATEXLA1 (AT3G45970), glycosyl transferase (AT2G41640), GAPCP-1 (AT1G79530) and GAPCP-2 (AT1G16300). Results were normalized using the expression of TIP41-like (AT4G34270) as loading control and then to the average of the WT expression. The analysis was performed using four different RNA samples for each genotype. t-test. P-values are indicated above rns2-2–WT comparisons with a significant difference in expression level.

