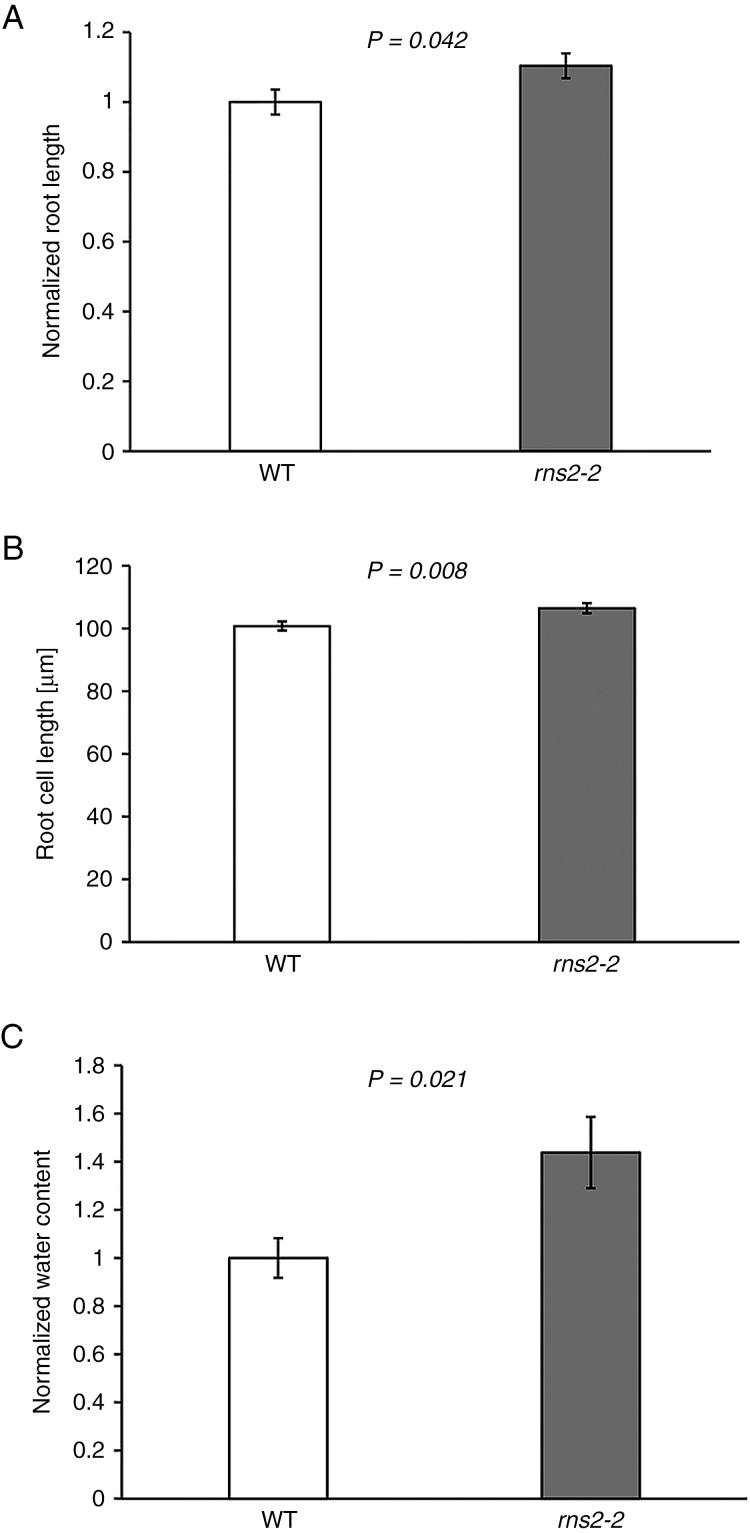
Fig. 6.
Phenotypic characterization of rns2-2 plants. (A) Root length was measured in 10-day-old WT and rns2-2 seedlings grown on vertical agar plates. t-test P-value is indicated. Three independent plates containing the two genotypes (15 plants for each genotype per plate) were analysed. Both plant size and root length were normalized to the average of the WT values. (B) Roots were stained with propidium iodide and Oregon Green dyes, and imaged using a confocal microscope. After image capture, cell lengths were measured using ImageJ. t-test P-value is indicated. More than 500 cells were measured for each genotype. (C) Water content was determined as the weight difference of basal rosette tissue from WT and rns2-2 seedlings grown as in Fig. 4, before and after 4 d of lyophilization. The dry weight/wet weight ratio was normalized to the WT average. t-test P-value is indicated. Five independent samples for each genotype were analysed.

