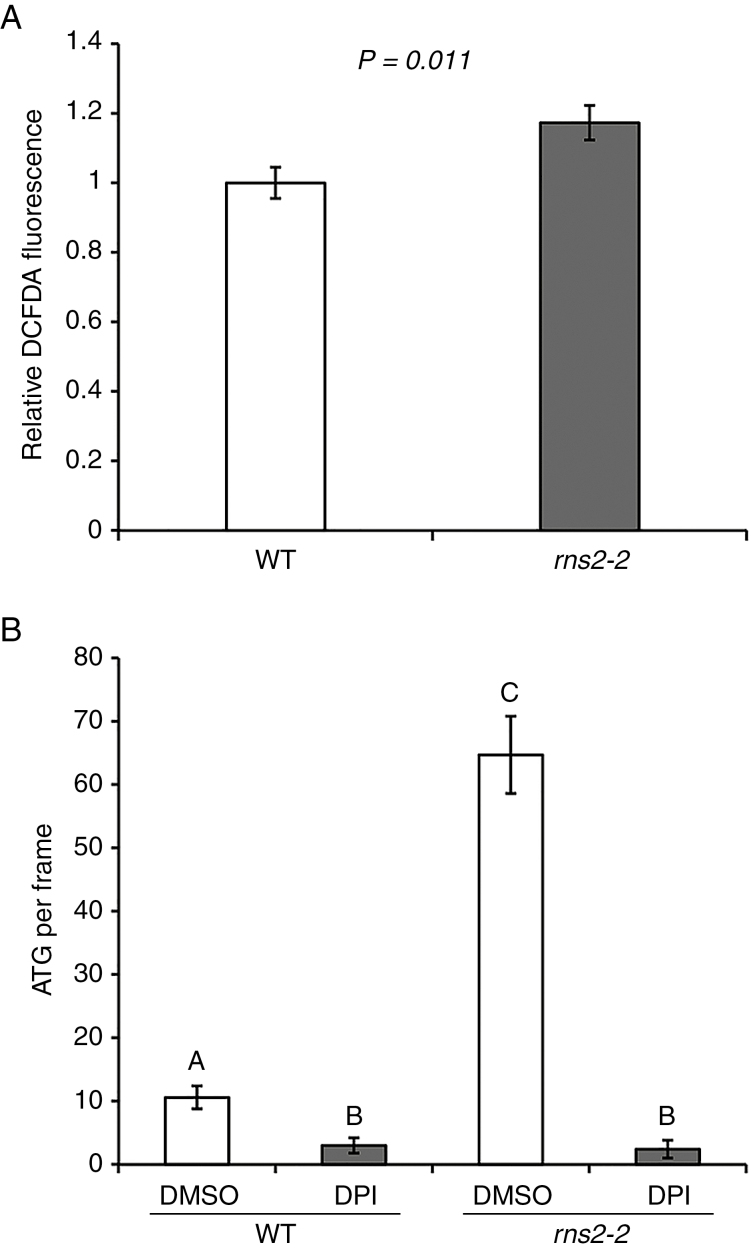
Fig. 7.
ROS signalling controls autophagy in rns2-2 plants. (A) Measurement of ROS. Seven-day-old seedlings were stained with DCFDA to detect ROS. Fluorescence was measured using microscopy. and statistical comparison between WT and mutant was performed using Student’s t-test (P < 0.05). From 44 to 60 total measurements per genotype were taken from six independently grown sets. (B) Effect of DPI treatment on the rns2-2 autophagy phenotype. Roots of WT or rns2-2 seedlings were treated with DPI (NADPH oxidase inhibitor) or DMSO and then stained with MDC and imaged using fluorescence microscopy. The number of autophagosomes per frame was quantified. Statistical analysis was performed using Student’s t-test (P > 0.05) in comparisons against each treatment and genotype

