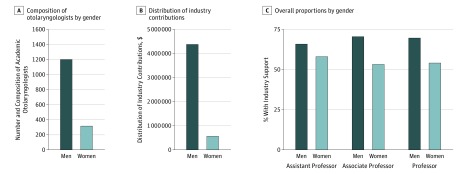
Figure 1. Gender Distribution of Industry Contributions Among Academic Otolaryngologists.
A, Gender composition of otolaryngologists. B, Distribution of industry contributions. C, Overall proportion of men and women receiving industry contributions organized by academic rank. The dark bars represent men, light bars represent women.

