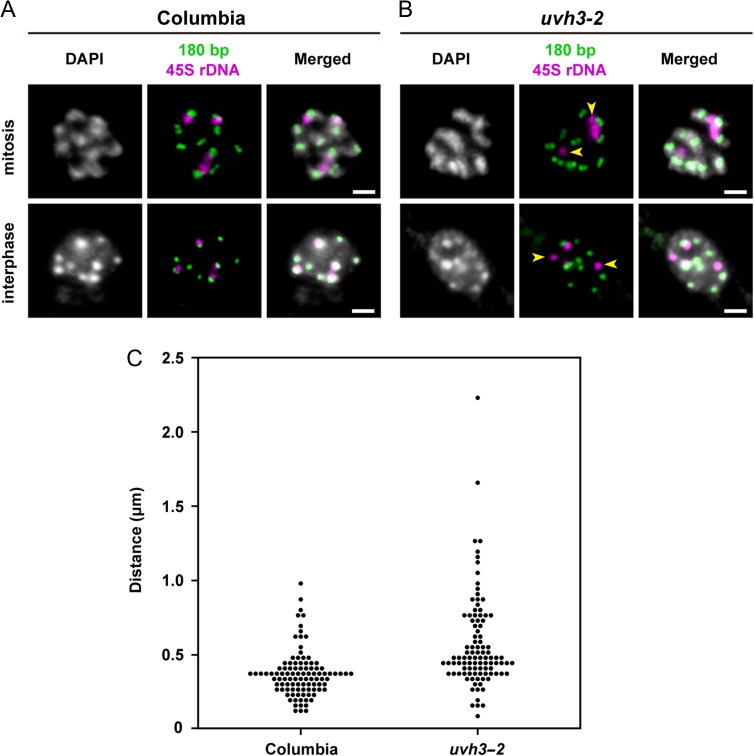
Fig. 5.
Detection of centromeric 180 bp repeats and 45S rDNA. (A) Columbia (B) uvh3-2. The upper and lower images show mitotic chromosomes and interphase nuclei, respectively. Arrowheads indicate 45S rDNA signals not associated with 180 bp signals. Scale bars, 2 μm. (C) Dot-density plot of distance between 45S rDNA and the nearest 180 bp repeat signals from interphase nuclei of Columbia (n = 100) and uvh3-2 (n = 100). A significant difference was detected between Columbia and uvh3-2 using Welch's t-test (P < 0.01).

