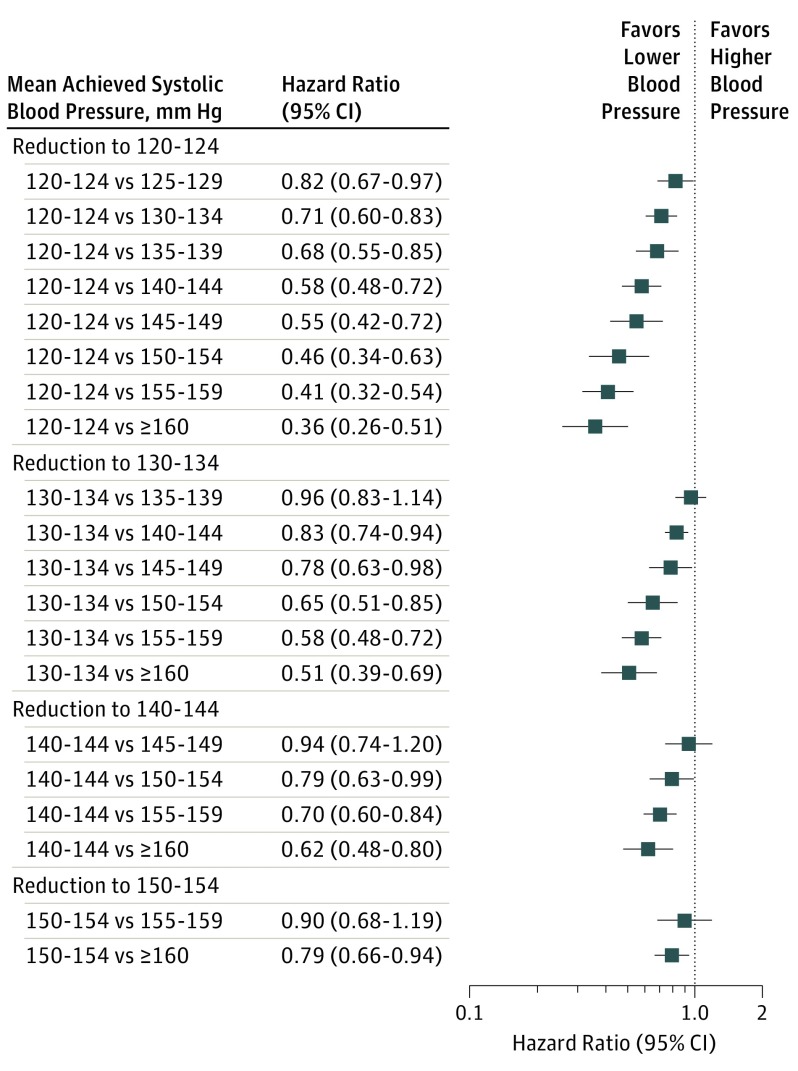
Figure 3. Hazard Ratios and 95% CIs for Major Cardiovascular Disease Associated With More Intensive Reductions in Systolic Blood Pressure.
Square markers indicate hazard ratios for major cardiovascular disease events comparing lower mean achieved systolic blood pressure with higher mean achieved systolic blood pressure. Error bars indicate 95% CIs.

