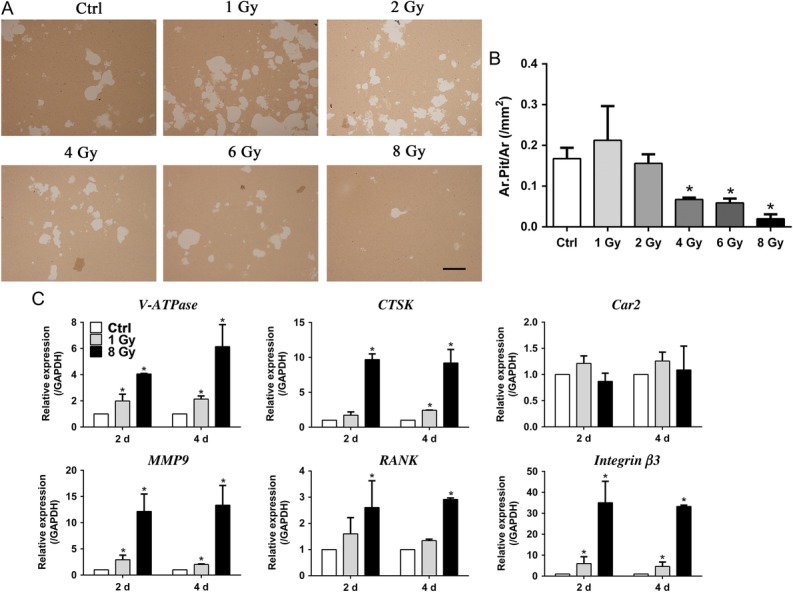
Fig. 5.

X-rays affected osteoclast resorption activity. (A–B) The level of bone resorption was determined by the pit formation assay and expressed as the area of absorbed pits per square millimeter. The white parts were pits resorbed by osteoclasts. Scale bar: 500 μm. (C) mRNA expression during osteoclast differentiation after IR treatment at Days 2 and 4 was examined, including expression of integrin β3, RANK, MMP9, V-ATPase, Car2 and CTSK (n = 3). All X-ray groups were compared with controls. Data shown are in the form of mean ± SD. *P < 0.05.
