Figure 3.

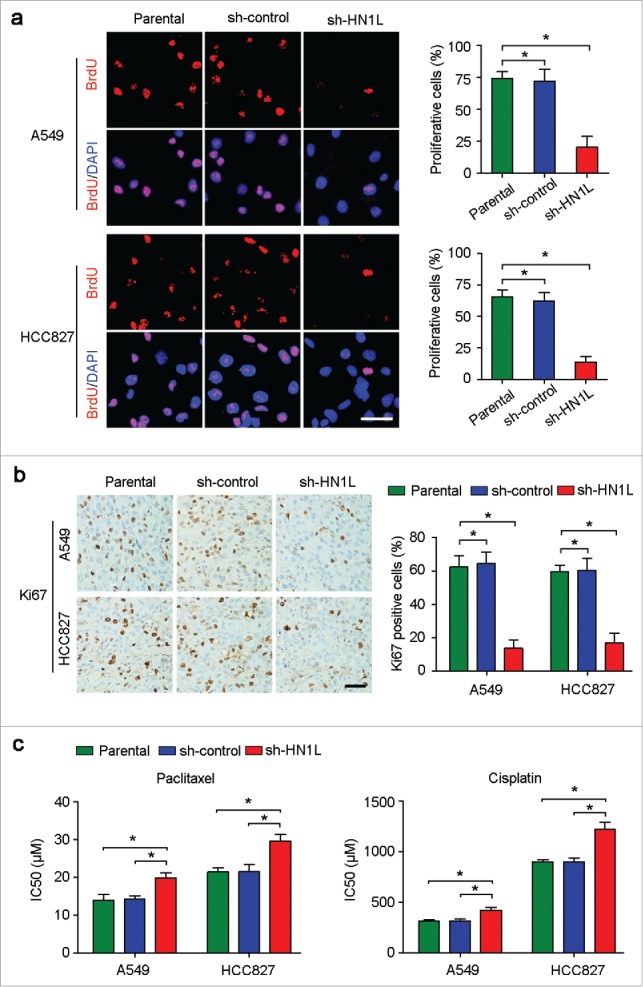
Aberrant HN1L expression indicated the malignant proliferation. (a) Knockdown of HN1L inhibited cell proliferation measured by BrdU incorporation assay. Scale bar, 50 μm. Data represent mean ± SD. *P < 0.05. (b) IHC staining showed the low-proportion of proliferative cells in tumor produced from HN1L silenced cells. Scale bar, 50 μm. Data represent mean ± SD. *P < 0.05. (c) The IC50 values of paclitaxel and cisplatin for A549 and HCC827 cells with or without HN1L silencing. Data represent mean ± SEM. *P < 0.05.
