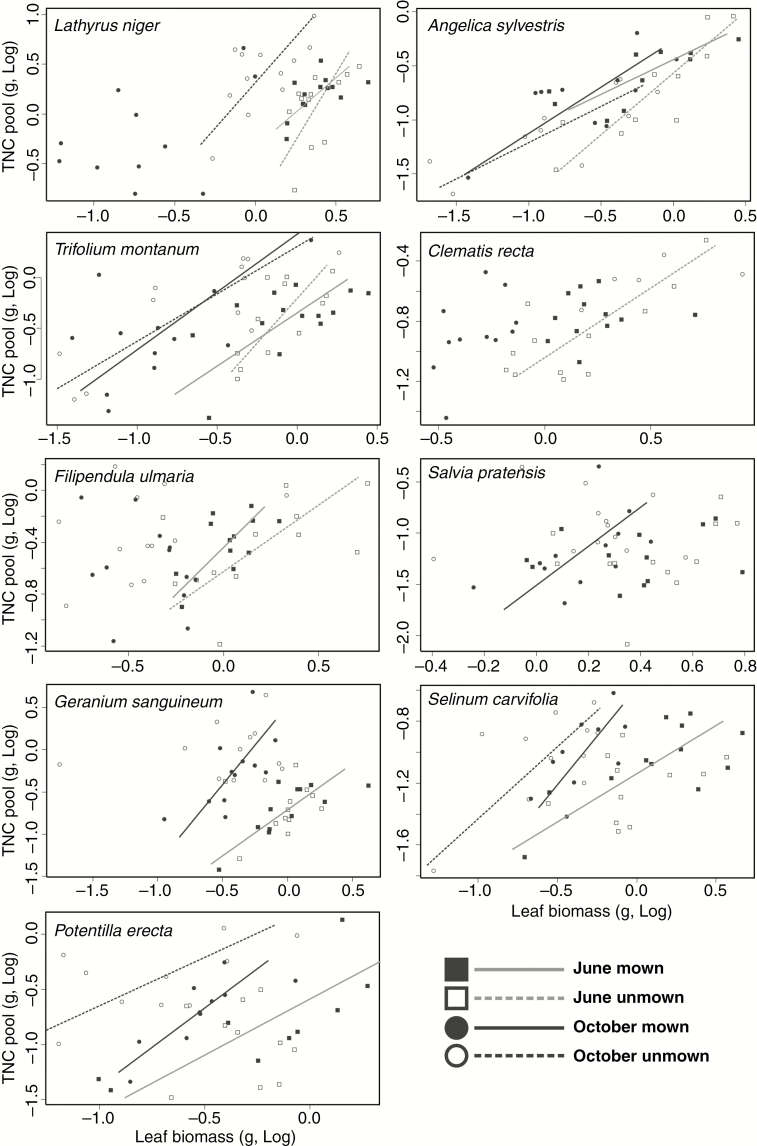
Fig. 2.
Relationship between leaf biomass and carbohydrate (TNC) pool for individual species sampled on two dates (June and October) and subjected to two treatments (mown and unmown). Note that only regression lines for relationships with P < 0.1 are shown. Related statistical analyses are given in Table 1.

