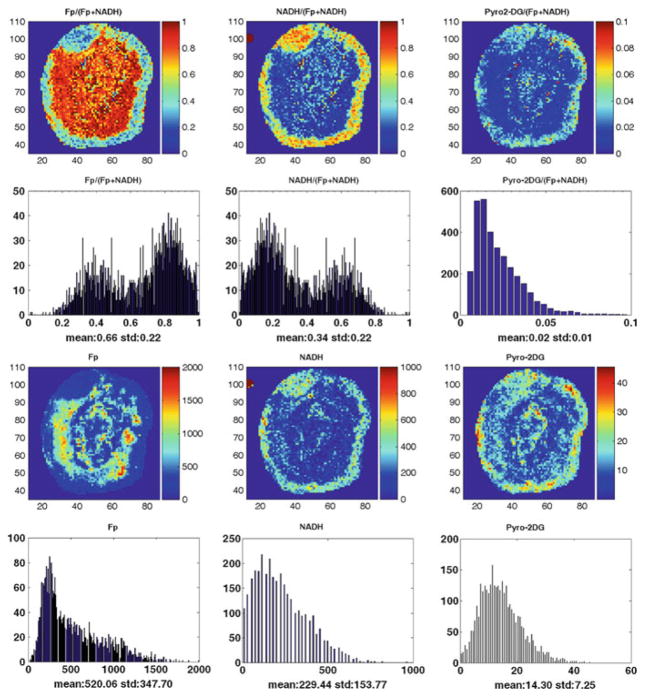
Fig. 26.1.
Typical mitochondrial redox state and Pyro-2DG uptake images and their corresponding histograms of a representative MDA-MB-231 tumor (the tumor section had no scar). The Fp redox ratio, NADH redox ratio, and normalized Pyro-2DG range between 0 and 1; the Fp, NADH, and Pyro-2DG images are in the unit of μM in reference to the corresponding standards. The mean values and the corresponding standard deviations of these indices are also shown on the x-axes of the histograms. The y-axes represent the number of pixels in the tumor section having a specific value of the indices shown by the x-axes of the histograms

