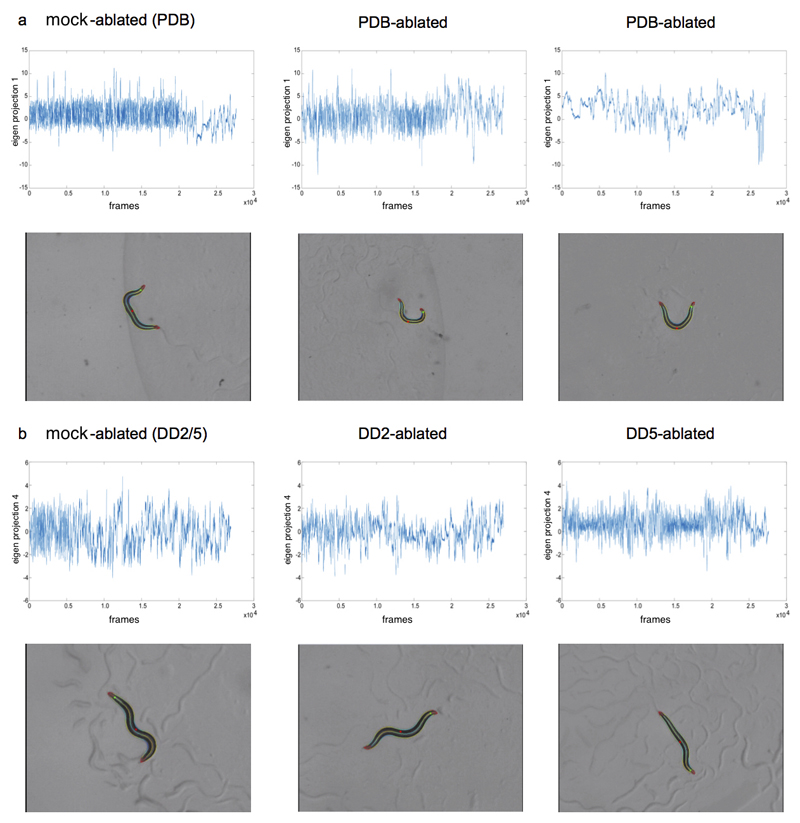
Extended Data Figure 6.
Illustrative examples of the behavioural phenotypes observed for PDB- and DD-ablated animals. Time series plots of sample videos, and still images from these videos, illustrating the locomotion abnormalities resulting from ablation. The green dot indicates the animal’s head, and the red dot in the mid-body indicates the ventral side. (a) For PDB-ablated animals compared to mock-ablated controls, we observed differences in Eigen Projection 1, which describes the large wavelength body bends that occur during turning. The lower negative values observed in PDB-ablations indicate a loss of the ventral bias to these turns. Still images show PDB-ablated animals making a large dorsal turn, whereas turns in control animals are usually ventral. The videos used here (from L to R) are ‘mockPDB_onfood_L_2016_11_03__14_16_37___7___1’, ‘ablPDB_onfood_L_2016_11_03__14_40_04___4__2', and ‘ablPDB_onfood_L_2016_11_04__14_28_26___5___1'. (b) DD5-ablated animals showed lower values for Eigen Projection 4, which captures the small wavelength oscillations in the head and tail. The lower values indicate a reduction in amplitude of tail oscillations compared with controls, i.e. a characteristic stiff tail appearance. The videos shown here (from L to R) are ‘mockDD_onfood_L_2016_10_29__13_13_35 ___7___6’, ‘DD2_onfood_R_2016_10_30__12_13_57___7___4’, and ‘DD5_onfood_ L_2016_10_29__13_13_25___5___6’.

