

Abstract
Cerebral CT perfusion (CTP) imaging is playing an important role in the diagnosis and treatment of acute ischemic strokes. Meanwhile, the reliability of CTP-based ischemic lesion detection has been challenged due to the noisy appearance and low signal-to-noise ratio of CTP maps. To reduce noise and improve image quality, a rigorous study on the noise transfer properties of CTP systems is highly desirable to provide the needed scientific guidance. This paper concerns how noise in the CTP source images propagates to the final CTP maps. Both theoretical deviations and subsequent validation experiments demonstrated that, the noise level of background frames plays a dominant role in the noise of the cerebral blood volume (CBV) maps. This is in direct contradiction with the general belief that noise of non-background image frames is of greater importance in CTP imaging. The study found that when radiation doses delivered to the background frames and to all non-background frames are equal, lowest noise variance is achieved in the final CBV maps. This novel equality condition provides a practical means to optimize radiation dose delivery in CTP data acquisition: radiation exposures should be modulated between background frames and non-background frames so that the above equality condition is satisïňĄed. For several typical CTP acquisition protocols, numerical simulations and in vivo canine experiment demonstrated that noise of CBV can be effectively reduced using the proposed exposure modulation method.
Keywords: CT perfusion, MDCT, noise characteristics, image quality, radiation dose, acute ischemic stroke
1. INTRODUCTION
Cerebral CT perfusion (CTP) imaging has been widely used in the diagnosis and treatment of acute ischemic strokes. Ischemic lesions detected in different types of CTP maps [e.g., cerebral blood volume (CBV) and cerebral blood flow (CBF)] and the mismatch of their sizes help interventional neuroradiologists to select patients who will benefit from intraarterial (IA) therapy from those for whom IA therapy is both futile and carries increased risk of further injury. For example, ischemic lesions with severely reduced blood volume identified in CBV maps have been shown to be a strong predictor of hemorrhagic transformation and functional outcomes following IA therapy for acute ischemic strokes.1, 2 However, CTP-based ischemic lesion detection has been criticized due to the high noise and low signal-to-noise ratio (SNR) of CTP maps.3 In light of the recent success of clinical trials of IA therapy,4–7 there is a strong need to reduce noise in CTP images so that they can be reliably used for patient selection. From the standpoint of basic imaging science, there is no previous report available on how noise is propagated from CT source images to the final perfusion maps. Without a fundamental understanding of the noise transfer process in CTP systems, attempts to reduce noise while maintaining the needed diagnostic performance of CTP imaging will lose the needed scientific guidance.
In this paper, we report the first theoretical and experimental study on the noise characteristics of CBV maps. Based on a theoretical study, several important conclusions have been derived: First, the noise level of mask frames (a.k.a., background frames) plays a dominant role in the noise variance of CBV maps. This is in direct contradiction with the general belief that the noise in subsequent non-background CT image frames (i.e., frames acquired after contrast wash-in) is playing a more important role, which suggests that more radiation dose should be delivered to the mask frames. Second, the special condition in which the radiation dose delivered during the acquisition of background images frames is equal to the radiation dose delivered to all later contrast-enhanced frames yields the lowest noise variance in the final CBV maps. Third, this novel equality condition provides a practical means to optimize radiation dose delivery in CT perfusion imaging: radiation exposures should be modulated for background frames and subsequent contrast-enhanced frames, so that the above equality condition is satisfied to achieve the lowest noise magnitude in CBV. Both numerical simulations and in vivo animal experient have been performed to validate these noise properties.
2. METHODS
2.1. Theory
In perfusion imaging, CBV is given by the ratio between the area under the tissue contrast enhancement curve C(t) and the area under the arterial contrast enhancement curve A(t) as
| (1) |
where κ is a constant determined by the density of brain tissue and the relative difference between the hematocrit of artery and the hematocrit of capillary bed. In x-ray CT-based perfusion imaging, C(t) and A(t) are measured based on the pixel value of time-resolved CT images I(t). One of the basic assumptions made in CT perfusion imaging is that the increment in CT number is linearly proportional to the concentration of contrast density, namely
| (2) |
and
| (3) |
In Eqs.(2)–(3), α is a numerical scaling factor, Ib represents the pixel value of CT images acquired prior to the wash-in of contrast bolus; Ib is often referred to as the mask image or the baseline image. The superscript A signifies arterial (with no superscript signifying tissue). To solve for CBV, the baseline image needs to be subtracted from the CT image in each time frame before being integrated along the temporal direction, namely
| (4) |
where N is the total number of time frames acquired during a CTP exam. In practice, there are usually Nb time frames acquired prior to the wash-in of contrast bolus, and these Nb time frames can be averaged to reduce noise in the baseline image, namely
| (5) |
Regardless of whether Nb = 1 or > 1, the summation of Ii − Ib (and ) from i = 1 to Nb in Eq. (4) is always equal to zero, therefore Eq. (4) can be reduced to
| (6) |
Due to radiation dose constraints and other nonidealities, the measured CT images will contain noise, which will propagate to the final CBV map and impair the physician’s ability to accurately detect perfusion deficits. For CT images acquired at different time frames, it is reasonable to assume that their noise is uncorrelated and stationary along the temporal direction. Let denote the noise variance of CT images acquired at each time point. Based on the general rule of error propagation, the noise variance of the summation in the numerator of Eq. (6) is given by
| (7) |
where we defined Na ≡ N − Nb as the total number of time frames acquired after the baseline frames. For the summation on the denominator of Eq. (6), , its noise variance is the same as , because the noise variance of IA is approximately the same as that of I under the stationary CT noise assumption. As a result, the noise variance of CBV is given by
| (8) |
Since the signal magnitude in artery is usually at least an order of magnitude higher than that in the brain tissue, namely Y ≫ X, we have
| (9) |
therefore the following approximations can be made:
| (10) |
or
| (11) |
Based on the fact that and , where D0 and Db are the radiation dose levels per time frame for non-baseline and baseline frames, respectively, Eq. (11) becomes
| (12) |
where D0 and Db are related to the total radiation dose delivered during a CTP exam (D) via
| (13) |
The central scientific aim of this work was to seek an optimal partition of the total radiation dose D between the baseline and non-baseline time frames, such that the noise variance of the final CBV map is minimized. Based on Eq. (12) and the constraint in Eq. (13), this goal was achieved by solving the following constrained optimization problem:
| (14) |
An analytical solution of this constrained optimization problem can be easily derived, yielding the optimal radiation dose partition as
| (15) |
This optimal partition scheme also indicates that the total dose delivered for the Nb baseline frames is equal to the total dose delivered to all other non-baseline image frames, namely NbDb = NaD0 = D/2.
The optimal mAs partition is the same as the dose partition given in Eq. (15), since dose is proportional to mAs when kV and other scan parameters are fixed. Apparently, a much larger mAs should be used for the baseline image frames since Na ≫ Nb. With the same total radiation dose, the ratio in between the optimized mAs modulation and constant mAs is
| (16) |
Since
| (17) |
the ratio in Eq. (16) is always ≤ 1 (it equals 1 when Nb = N/2, which is unlikely). Therefore, the proposed mAs modulation scheme leads to noise reduction in CBV; the magnitude of reduction depends on the specific values of N and Nb: for a CTP acquisition protocol with N = 60 and Nb = 5, the relative reduction in the noise variance of CBV is 70%.
2.2. Validation methods
The theoretical derivations of the proposed mAs modulation method were first validated using numerical simulations. An anthropomorphic 4D digital CT perfusion phantom modified from the model developed by Manhart et al. was used.8 Fig. 1 shows the ground truth of its CBV map; the wedge-shaped perfusion deficit with reduced blood volume was simulated by a neurosurgeon. To simulate realistic CT image noise, Poisson noise was added in the sinogram space; the variance of the Poisson noise was proportional to mAs. Two acquisition protocols were used in our simulations, both having a total acquisition time of 60 s. For Protocol A, N = 60, Nb = 5 (Δt = 1 s); for protocol B, N = 20, Nb = 2 (Δt = 3 s). Simulated acquisitions with both constant mAs and proposed modulated mAs were performed, generating two sets of CBV maps for each protocol. The ratio in the measured noise variances of CBV between the constant and modulated mAs acquisitions were compared with theoretical predictions given by Eq. (16).
Figure 1.
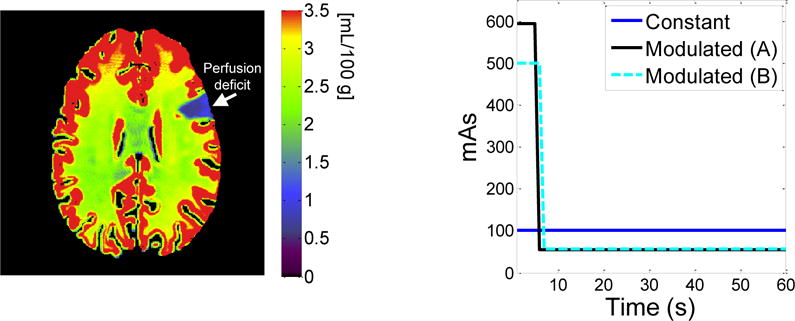
(left) Ground truth of CBV for the digital phantom. A lesion with perfusion deficit was created at the 2 o’clock position in the phantom. (right) Comparison of constant mAs and modulated mAs used for Protocol A and B of the simulation studies.
The mAs modulation method was also validated qualitatively using an in vivo canine stroke model: an ischemic stroke was induced in the left cerebral hemisphere of an adult beagle via an endovascular approach. Two CTP acquisitions were performed using a 64-slice CT scanner (Discovery CT750 HD, GE Healthcare, Waukesha, WI) with the following parameters: kV= 80, axial scan mode, detector collimation= 64 × 0.625 mm, gantry rotation time= 0.5 s, scan field of view (SFOV) = “head”, prep delay time = 5 s, total acquisition time T = 46 s, total number of time frames N = 23, temporal sampling rate Δt = 2 s, image display field of view (DFOV)= 6 cm, “Standard” reconstruction kernel, slice thickness= 5 mm, image matrix size= 512×512×8. Two CTP acquisitions were performed. The first CTP acquisition used the proposed optimal dose partition method: the tube current was 575 mA for the first two frames and was reduced to 55 mA for the other 21 frames. The second CTP acquisition used a constant tube current of 100 mA. The radiation dose (in terms of CTDIvol) for both CTP acquisitions was 98 mGy. For each CTP acquisition, 15 ml of Isovue 370 was injected intravenously at a rate of 3 ml/s, following by 10 ml of saline chase at the same rate. A delay time of 5 minutes was enforced between the two CTP acquisitions to allow the washout of contrast agent. CBV was generated using the same in-house perfusion processing software. A 2D pillbox filter with a radius of 0.6 mm was applied to each axial slice of the source images to reduce noise.
3. RESULTS
As shown in Fig. 2, CBV maps acquired using the proposed mAs modulation scheme demonstrated significant noise reductions: For Protocol A, the measured and are 0.27 and 0.89 [mL/100 g]2, respectively. Their ratio is 0.30, which is consistent with the theoretically predicted ratio of 4 × 5 × (60 − 5)/602 = 0.31; For protocol B, the measured and are 0.78 and 1.10 [mL/100 g]2, respectively. The ratio between these two numbers is 0.37, which is also consistent with the theoretically predicted ratio of 4 × 2 × (20 − 2)/202 = 0.36. Compared with the CBV maps acquired with constant mAs, the visibilities of the wedge-shaped ischemic lesion in the CBV maps acquired with modulated mAs have been significantly improved. Fig. 3 shows CBV maps of the in vivo canine stroke model. As expected, mAs modulation significantly reduced noise in the CBV map, making the perfusion deficit located in the left cerebral hemisphere of the canine subject much more visible.
Figure 2.
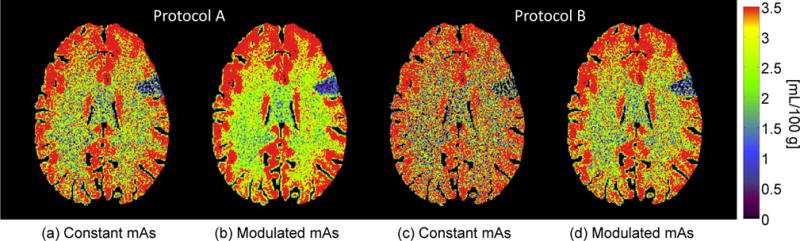
(a) and (b) are obtained using Protocol A (N = 60, Nb = 5) and with the same amount of radiation dose; (a) used a constant mAs of 100, while (b) used modulated mAs of mAs0 = 54 and mAsb = 600. (c) and (d) are obtained using Protocol B (N = 20, Nb = 2) with the same dose; (c) used a constant mAs of 100, while (d) used modulated mAs of mAs0 = 56 and mAsb = 500. The color bar on the right applies to all.
Figure 3.
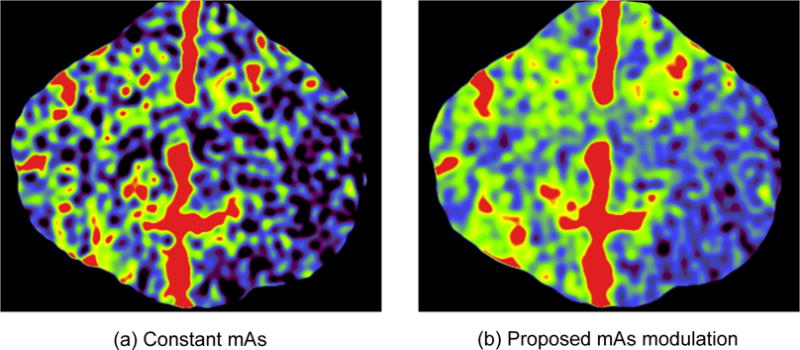
Comparison of CBV maps of the in vivo canine stroke model acquired using constant mAs and modulated mAs. Except mAs modulation methods, all other reconstruction and postprocessing parameters were matched between the two images, including a constant radiation dose of 98 mGy. The ischemic lesion is the blue region located in the left cerebral hemisphere.
4. CONCLUSION
The noise transfer process from CTP source images to CBV maps was analytically modeled, based on which several important ïňĄndings regarding the noise character- istics of CBV were identiïňĄed. In particular, the noise magnitude of CBV was dominated by the noise magnitude of the nonehanced baseline image. Based on this property, a novel frame-by-frame mAs modulation method was developed to reduce noise and improve image quality of CBV maps.
Acknowledgments
This work is partially supported by a NIH Grant (No. U01EB021183) and the 2015 AAPM Research Seed Grant. The authors are grateful to Dr. Charles Strother, Dan Consigny, and Dr. Kai Niu for their assistance with the animal experiments.
References
- 1.Rai AT, Raghuram K, Carpenter JS, Domico J, Hobbs G. Pre-intervention cerebral blood volume predicts outcomes in patients undergoing endovascular therapy for acute ischemic stroke. J NeuroIntervent Surg. 2013;5:i25–i32. doi: 10.1136/neurintsurg-2012-010293. [DOI] [PubMed] [Google Scholar]
- 2.Jain A, Jain M, Kanthala A, Damania D, Stead L, Wang H, Jahromi B. Association of CT perfusion parameters with hemorrhagic transformation in acute ischemic stroke. Am J Neuroradiol. 2013;34(10):1895–1900. doi: 10.3174/ajnr.A3502. [DOI] [PMC free article] [PubMed] [Google Scholar]
- 3.Gonzalez RG. Low signal, high noise and large uncertainty make CT perfusion unsuitable for acute ischemic stroke patient selection for endovascular therapy. J NeuroIntervent Surg. 2012;4(4):242–245. doi: 10.1136/neurintsurg-2012-010404. [DOI] [PubMed] [Google Scholar]
- 4.Berkhemer OA, et al. A randomized trial of intraarterial treatment for acute ischemic stroke. N Engl J Med. 2015;372(1):11–20. doi: 10.1056/NEJMoa1411587. [DOI] [PubMed] [Google Scholar]
- 5.Saver JL, et al. Stent-retriever thrombectomy after intravenous t-PA vs. t-PA alone in stroke. N Engl J Med. 2015;372(24):2285–2295. doi: 10.1056/NEJMoa1415061. [DOI] [PubMed] [Google Scholar]
- 6.Goyal M, et al. Randomized assessment of rapid endovascular treatment of ischemic stroke. N Engl J Med. 2015;372(11):1019–1030. doi: 10.1056/NEJMoa1414905. [DOI] [PubMed] [Google Scholar]
- 7.Campbell BC, et al. Endovascular therapy for ischemic stroke with perfusion-imaging selection. N Engl J Med. 2015;372(11):1009–1018. doi: 10.1056/NEJMoa1414792. [DOI] [PubMed] [Google Scholar]
- 8.Manhart MT, Aichert A, Struffert T, Deuerling-Zheng Y, Kowarschik M, Maier A, Hornegger J, Doerfler A. Denoising and artefact reduction in dynamic flat detector CT perfusion imaging using high speed acquisition: first experimental and clinical results. Phys Med Biol. 2014;59(16):4505. doi: 10.1088/0031-9155/59/16/4505. [DOI] [PubMed] [Google Scholar]