Abstract
Noonan syndrome (NS) is a common genetic syndrome associated with gain of function variants in genes in the Ras/MAPK pathway. The phenotype of NS has been well characterized in populations of European descent with less attention given to other groups. In this study, individuals from diverse populations with Noonan syndrome were evaluated clinically and by facial analysis technology. Clinical data and images from 125 individuals with NS were obtained from 20 countries with an average age of 8 years and female composition of 46%. Individuals were grouped into categories of African descent (African), Asian, Latin American and additional/other. Across these different population groups, NS was phenotypically similar with only 2 of 21 clinical elements showing a statistically significant difference. The most common clinical characteristics found in all population groups included widely spaced eyes and low-set ears in 80% or greater of participants, short stature in more than 70%, and pulmonary stenosis in roughly half of study individuals. Using facial analysis technology, we compared 161 Caucasian, African, Asian, and Latin American individuals with NS with 161 gender and age matched controls and found that sensitivity was equal to or greater than 94% for all groups, and specificity was equal to or greater than 90%. In summary, we present consistent clinical findings from global populations with NS and additionally demonstrate how facial analysis technology can support clinicians in making accurate NS diagnoses. This work will assist in earlier detection and in increasing recognition of NS throughout the world.
Keywords: Noonan syndrome, diverse populations, Asia, Africa, Latin America, Middle East, facial analysis technology
INTRODUCTION
Noonan syndrome (NS) is characterized by congenital heart disease, short stature, distinctive facial features, chest deformities, variable developmental delay and other anomalies (Bhambhani and Muenke 2014; Noonan 1968). Diagnostic criteria have been established (van der Burgt et al., 1994) as well as management guidelines (Roberts et al., 2013; Romano et al., 2010). The typical facial features of NS include widely spaced eyes, downslanted palpebral fissures, ptosis, and low-set ears. The prevalence of Noonan syndrome is roughly 1:1,000 to 1:2,500 and is inherited in an autosomal dominant manner (Romano et al., 2010). Although Noonan syndrome is a common genetic syndrome, there are few phenotype and genotype studies in non-European cohorts.
The genetic etiologies of NS occur in genes associated with the Ras-mitogen-activated protein kinase (Ras/MAPK) pathway. Genes in this pathway are involved in cell differentiation, growth, and death. Other syndromes associated with Ras/MAPK genes include Costello syndrome, Cranio-facio-cutaneous (CFC) syndrome, Noonan syndrome with multiple lentigines (formerly called LEOPARD syndrome), and neurofibromatosis. Significant phenotypic overlap exists with other RASopathies including CFC syndrome and Costello syndrome. The most common genetic cause of NS is gain-of function mutations in the PTPN11 gene encoding the Src homology protein-tyrosine phosphatase-2 (SHP-2) with a variant occurring in 50% of individuals with NS (Tartaglia et al., 2002; Tartaglia et al., 2001). PTPN11 was the first gene to be associated with NS and now there are more than 8 known genes (PTPN11, SOS1, RAF1, RIT1, KRAS, NRAS, BRAF, MAP2K1, RRAS, RASA2, A2ML1, SOS2, LZTR1) that cause NS (Allanson and Roberts 1993). SOS1 is the second most common causative gene with variants occurring in 16–20% of individuals without PTPN11 variants (Roberts et al., 2007; Tartaglia et al., 2007).
A number of investigators have evaluated PTPN11 variants in diverse populations. In a Brazilian cohort of 50 individuals with NS, 42% were found to have PTPN11 variants, but the most common variant, p.N308D, which was found in 31% of a North American cohort (Tartaglia et al., 2002) was not present (Bertola et al., 2006), demonstrating that different variants are found in different populations. In contrast, Lee et al. 2007 found half of a Korean cohort of individuals with NS to have previously reported PTPN11 variants including 29% of the cohort with the p.N308D variant (Lee et al., 2007). In another Korean cohort of 59 patients, Ko et al. found that in 13 patients with PTPN11 variants, 12 had been previously reported (Ko et al., 2008). Although genotypes have been compared, the phenotype in NS has not been contrasted between different countries and populations. However, investigators in some countries have defined regional height phenotypes in NS and have developed growth charts specific to their country including Japan (Isojima et al., 2016) and Brazil (Malaquias et al., 2012).
Noonan syndrome can be a difficult diagnosis to make as the phenotype is variable and changes with age (Allanson et al., 1985; van der Burgt et al., 1999). Comprehensive characterization of Noonan syndrome in diverse populations has not yet been done in the medical literature. In this report, we use images, subjective examination data, and facial analysis technology to describe Noonan syndrome in diverse populations.
METHODS
Review of Medical Literature
Studies that characterize NS in diverse populations were obtained from a Medline search. The search terms used included: Noonan syndrome, Africa, Asia, Latin America, Middle East, diverse populations, and facial analysis technology. Further studies were found using reference lists of journal studies. After obtaining journal permissions, photos of individuals with NS were used to supplement study participants described below (Addissie et al., 2015; Aoki et al., 2013; Edwards et al., 2014; Lee and Sakhalkar 2014; Ndiaye et al., 2014; Yaoita et al., 2016).
Patients
Individuals with Noonan syndrome were evaluated from 20 countries. All participants (Supplementary Table I) had Noonan syndrome diagnosed by both clinical evaluation and/or molecular diagnosis. The patients were grouped by geographic area of origin or ethnicity (African and African American, Asian, Latin American, and Additional). Local clinical geneticists examined patients for established clinical features found in NS (van der Burgt et al., 1994).
Consent was obtained by local institutional review boards and the Personalized Genomics protocol at the National Institutes of Health (11-HG-0093). Exam findings from the current study and those from the medical literature are recorded in Table I.
Table I.
Summary of exam findings of individuals with Noonan syndrome from diverse backgrounds including 99 unpublished individuals from present study and 370 individuals from the medical literature (Bertola et al., 2006; Essawi et al., 2013; Hung et al., 2007; Jongmans et al., 2005; Ko et al., 2008; Lee et al., 2011; Lee et al., 2007; Ndiaye et al., 2014; Simsek-Kiper et al., 2013; Yoshida et al., 2004).
| Present Study | Hung et al., 2007 | Ndiaye et al., 2014 | Bertola et al., 2006 | Yoshida et al., 2004 | Lee et al., 2007 | Ko et al., 2008 | Simsek-Kiper et al., 2013 | Essawi et al. 2013 | Jongmans et al., 2005 | Lee et al., 2011 | ||||
|---|---|---|---|---|---|---|---|---|---|---|---|---|---|---|
| Africa | Asia | Latin America | P-values | Taiwan | Senegal | Brazil | Japan | Korea | Korea | Turkey | Egypt | The Netherlands | Korea | |
| n=30 | n=36 | n=33 | n=34 | n=6 | n=50 | n=45 | n=14 | n=59 | n=26 | n=21 | n=56 | n=59 | ||
| Average age (years) | 9.3 | 8.6 | 9.9 | 9.06 years | 12 years | 10 years | 14.8 years | 8.8 years | 3.7 years | |||||
| Age range (years) | 0.33–30 | 0.17–31 | 0.17–31 | 1–31 years | 0.3–24.1 years | 0.1–34.5 years | 2–29 years | 0.1–17.2 years | 0.25–29 years | 2–20 years | ||||
| PTPN11 | 6/9 (67%) | 22/26 (85%) | 17/21 (81%) | 13 (38%) | 2 (33%) | 21 (42%) | 18 (40%) | 7 (50%) | 16 (27%) | 7 (27%) | 56 (100%) | 23 (39%) | ||
| SOS1 | 2/26 (8%) | 2/21 (10%) | 10 (17%) | 5 (19%) | 12 (20%) | |||||||||
| SHOC2 | 0 | 3 (12%) | ||||||||||||
| widely spaced eyes | 80% | 96% | 94% | 0.10 | 6 (100%) | 22 (44%) | 45 (100%) | 22 (85%) | 21 (100%) | |||||
| ptosis | 63% | 72% | 94% | 0.011 | 12 (35%) | 25 (96%) | 6 (29%) | |||||||
| downslanted palpebral fissures | 87% | 86% | 73% | 0.25 | 20 (59%) | 33 (66%) | 19 (73%) | 21 (100%) | ||||||
| epicanthal folds | 70% | 64% | 55% | 0.44 | 19 (56%) | |||||||||
| low-set ears | 82% | 94% | 88% | 0.30 | 1 (17%) | 15 (58%) | 12 (57%) | |||||||
| lowset posterior hairline | 64% | 76% | 69% | 0.57 | 25 (74%) | |||||||||
| webbed neck | 57% | 36% | 69% | 0.023 | 21 (62%) | 3 (50%) | 46 (92%) | 10 (71%) | 16 (62%) | 21 (100%) | 10 (18%) | 48.30% | ||
| pulmonary stenosis | 50% | 53% | 48% | 0.94 | 12 (35%) | 2 (33%) | 28 (56%) | 16 (36%) | 8 (57%) | 24 (41%) | 16 (62%) | 5 (24%) | 38(68%) | 22/43 (51%) |
| hypertrophic cardiomyopathy | 7% | 11% | 10% | 0.82 | 3 (50%) | 6 (12%) | 5 (11%) | 13 (22%) | 2 (8%) | 4 (19%) | 4 (7%) | 11/43 (26%) | ||
| ASD | 27% | 14% | 24% | 0.39 | 14 (31%) | 6 (43%) | 19 (32%) | 11 (42%) | 17 (30%) | 12/43 (28%) | ||||
| VSD | 7% | 17% | 6% | 0.26 | 2 (14%) | 13 (22%) | 3 (12%) | 7/43 (16%) | ||||||
| septal defects | 37% | 36% | 27% | 0.66 | 16 (47%) | 11 (79%) | 14/26 (54%) | |||||||
| PDA | 0% | 8% | 0% | 7 (12%) | 7/43 (16%) | |||||||||
| short stature (<3rd centile%) | 71% | 80% | 83% | 0.53 | 32 (94%) | 6 (100%) | 48 (96%) | 9 (64%) | 30 (51%) | 14/26 (54%) | 15 (71%) | 41 (73%) | 27/41 (66%) | |
| chest deformity | 59% | 49% | 70% | 0.21 | 13 (38%) | 4 (67%) | 28 (56%) | 9 (20%) | 9 (64%) | 14 (24%) | 17 (81%) | 24 (43%) | 16/43 (37%) | |
| Scoliosis | 37% | 17% | 13% | 0.08 | 9/47 (19%) | |||||||||
| Undescended testes | 47% | 26% | 47% | 0.17 | 1/2 (50%) | 14/27 (52%) | 9/25 (36%) | 4/9 (44%) | 19/41 (46%) | 4/12 (33%) | 27/32 (84%) | 11/29 (38%) | ||
| Coagulopathy | 26% | 14% | 6% | 0.12 | 20/48 (42%) | 5 (11%) | 3 (5.1%) | 32 (57%) | 4/43 (9%) | |||||
| Learning disability/intellectual disability | 64% | 54% | 63% | 0.69 | 19 (56%) | 11/43 (26%) | 12 (46%) | 11 (52%) | 28 (50%) | 11/40 (28%) | ||||
| Renal anomalies | 11% | 17% | 10% | 0.75 | 7/50 (14%) | |||||||||
| Skin pigmentation lesions | 12% | 38% | 27% | 0.12 | ||||||||||
Facial Analysis Technology
As previously described (Kruszka et al., 2017a; Kruszka et al., 2017b), digital facial analysis technology (Cerrolaza et al., 2016; Zhao et al., 2014a; Zhao et al., 2013; Zhao et al., 2014b) was used to evaluate 161 images of individuals with NS, and 161 ethnic, gender, and age matched controls from our previously described database (Zhao et al., 2014a; Zhao et al., 2013; Zhao et al., 2014b). The 161 individuals with NS used for facial analysis technology included individuals from Supplementary Table I and additional archival images of individuals with NS. A Caucasian ethnic group was identified in addition to African, Asian and Latin American for the purpose of facial analysis. The distribution of the dataset is presented in Table II. Only frontal images were analyzed by this technology.
Table II.
Population data used in facial analysis technology which includes 161 individuals with Noonan syndrome from Supplementary Table I and additional archival images of individuals with Noonan syndrome.
| Noonan syndrome (N=161) | Controls (N=161) | |||
|---|---|---|---|---|
|
| ||||
| Age | Number | % | Number | % |
| Newborn | 0 | 0% | 0 | 0% |
| Infant | 45 | 28% | 45 | 28% |
| Toddler | 29 | 18% | 29 | 18% |
| Child | 47 | 29% | 47 | 29% |
| Adolescence | 18 | 11% | 18 | 11% |
| Adult | 22 | 14% | 22 | 14% |
| Total | 161 | 161 | ||
|
| ||||
| Ethnicity | Number | % | Number | % |
|
| ||||
| African Descent | 35 | 22% | 35 | 22% |
| Asian | 40 | 25% | 40 | 25% |
| Caucasian | 40 | 25% | 40 | 25% |
| Latino | 46 | 29% | 46 | 29% |
| Total | 161 | 161 | ||
|
| ||||
| Gender | Number | % | Number | % |
|
| ||||
| Male | 93 | 58% | 93 | 58% |
| Female | 68 | 42% | 68 | 42% |
| Total | 161 | 161 | ||
Our algorithms analyzed the images of our study participants with output variables consisting of feature extraction, feature selection and classification. As in our previous studies (Kruszka et al., 2017a; Kruszka et al., 2017b), from a set of 44 landmarks placed on the frontal face images, a total of 126 facial features, including both geometric and texture biomarkers, were isolated. The geometric biomarkers consisted of a set of distances and angles calculated between the different inner facial landmarks. Figure 1 represents both the landmark locations and the geometric features extracted. Texture patterns (Cerrolaza et al., 2016) were calculated at each of the 33 inner facial landmarks to quantify texture information (Figure 1). From the collection of geometric and texture features, the most significant ones were selected using the method proposed previously (Cai et al., 2010). For each feature set, a support vector machine classifier (Cortes and Vapnik 1995) was trained using a leave-one-out cross-validation strategy (Elisseeff and Pontil 2003). The optimal number of features was selected as the minimum number for which the classification accuracy converged to its maximum; Supplementary Figures 1–5 graphically demonstrate how the addition of features improves the measures of sensitivity, specificity, and accuracy. As an estimator of the individual discriminant power of each feature selected, the P-value of each feature was also estimated using the Student’s t-test. Significance between methods used to detect NS was assessed using Fisher’s exact test.
Figure 1.
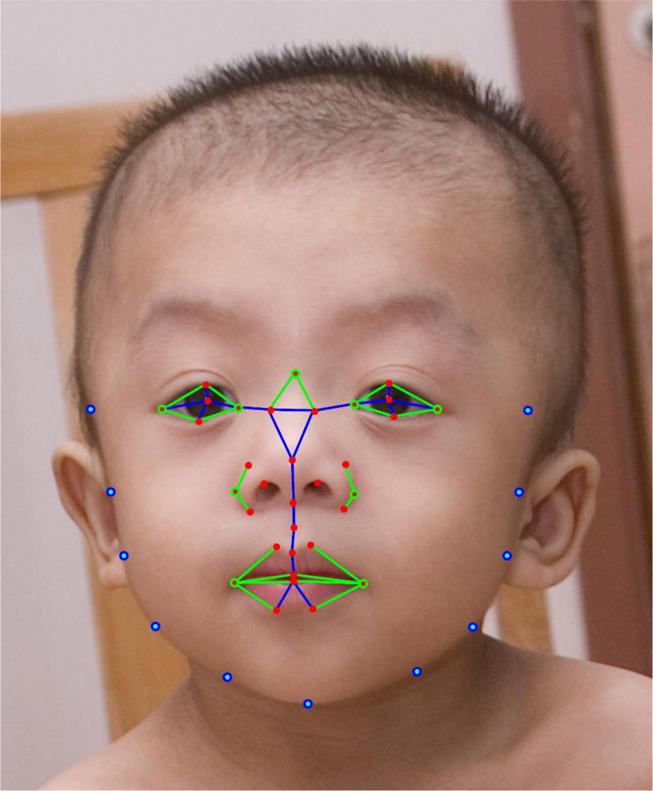
Facial landmarks on a Noonan syndrome patient. Inner facial landmarks are represented in red, while external landmarks are represented in blue. Blue lines indicate the calculated distances. Green circles represent the corners of the calculated angles. Texture features are extracted only from the inner facial landmarks.
RESULTS
Clinical information and images were collected on 125 individuals (13 individuals were obtained from the medical literature) from 20 countries, average age was 8 years, the median age was 5 years, and 46% were females (Supplementary Table I). Individuals of African descent are shown in Figure 2 (facial), Figure 5 (chronological sequence images), and Figure 6 (facial and torso profiles); Asian in Figure 3 (facial), Figure 5 (chronological sequence images), and Figure 7 (facial and torso profiles); Latin American in Figure 4 (facial), Figure 5 (chronological sequence images), and Figure 8 (facial and torso profiles); and additional patients in Supplementary Figure 6. Supplementary Figures 7 and 8 display hand and feet images, respectively. From the medical literature in Table I, we found 10 non-European descent studies of NS that evaluated at least five participants and at least one facial feature (Bertola et al., 2006; Essawi et al., 2013; Hung et al., 2007; Jongmans et al., 2005; Ko et al., 2008; Lee et al., 2011; Lee et al., 2007; Ndiaye et al., 2014; Simsek-Kiper et al., 2013; Yoshida et al., 2004). We compared unpublished patients from the present study with the above-mentioned studies from the medical literature (Table I). The most common phenotype element in both the present study and the medical literature is widely spaced eyes. In our study, all population groups had widely spaced eyes in 80% or greater of individuals, and in the medical literature, 4 of 5 studies report 85% or more of their cohorts as having widely spaced eyes (Table I). Low-set ears, also common in our cohort, was found in over 80% of the present study but not consistently reported in the literature. And lastly, short stature as defined by <3rd centile (when centiles were provided) was found in greater than 70% of the present study and in 7 of the 9 studies in the medical literature. The remainder of clinical exam findings in the present study were consistent between the different population groups; the only exam elements that differed statistically amongst groups in the present study were ptosis and webbed neck (P=0.01 and P=0.02, respectively; χ2 test). Consistent with the medical literature (Allanson and Roberts 1993), this study’s most common congenital heart disease was pulmonary stenosis, found in roughly 50% of all three population groups (Table I).
Figure 2.
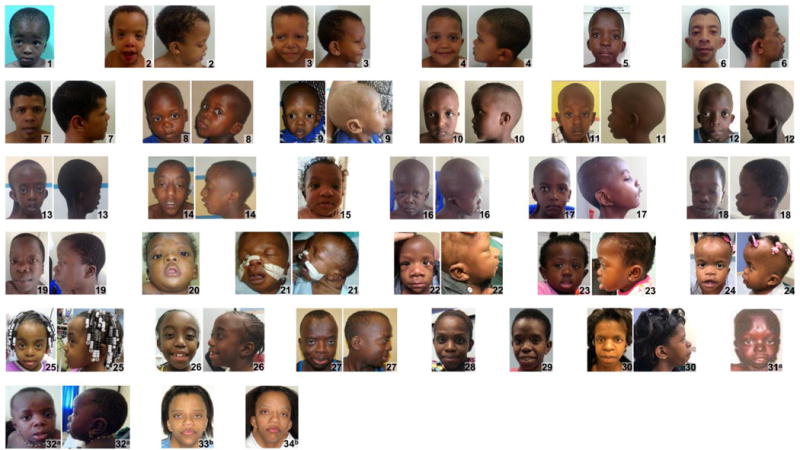
Frontal and lateral facial profiles of individuals of African descent with Noonan syndrome. Gender, age, and country of origin found in Supplementary Table I.
Figure 5.
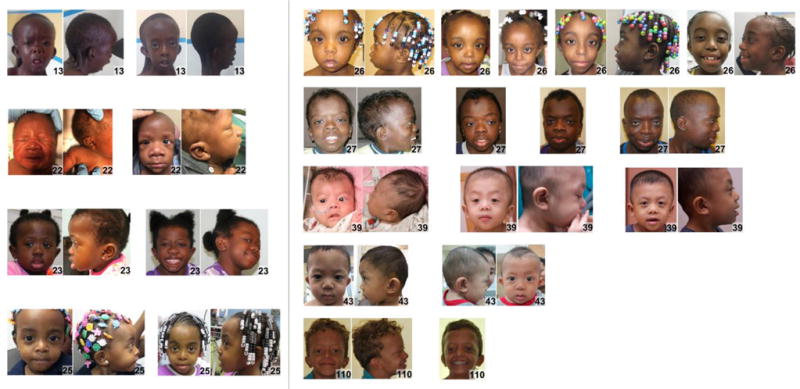
Sequential photos of individuals with Noonan syndrome at different ages. Gender, age, and country of origin found in Supplementary Table I.
Figure 6.
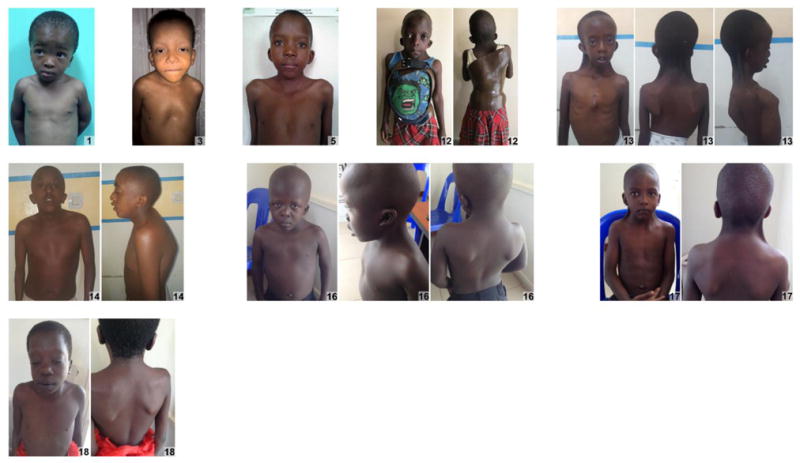
Facial and torso profiles of individuals of African descent with Noonan syndrome. Gender, age, and country of origin found in Supplementary Table I.
Figure 3.
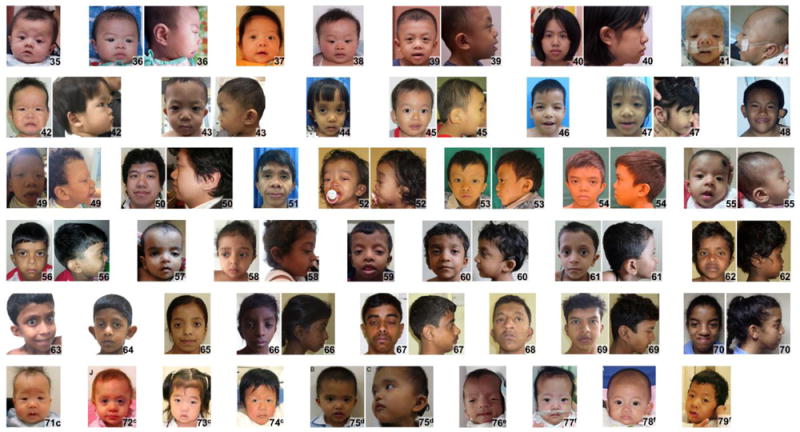
Frontal and lateral facial profiles of Asian individuals with Noonan syndrome. Gender, age, and country of origin found in Supplementary Table I.
Figure 7.
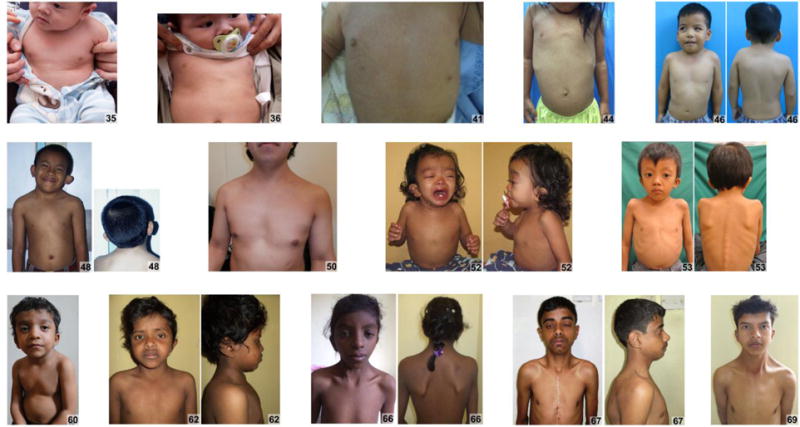
Facial and torso profiles of individuals of Asian individuals with Noonan syndrome. Gender, age, and country of origin found in Supplementary Table I.
Figure 4.
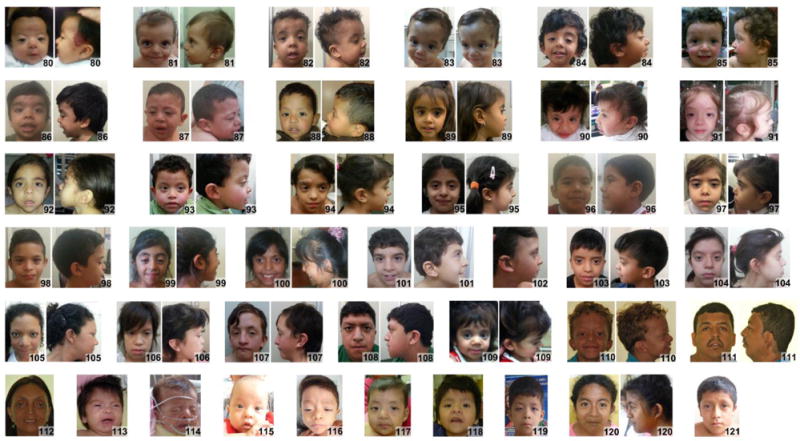
Frontal and lateral facial profiles of Latin Americans with Noonan syndrome. Gender, age, and country of origin found in Supplementary Table I.
Figure 8.
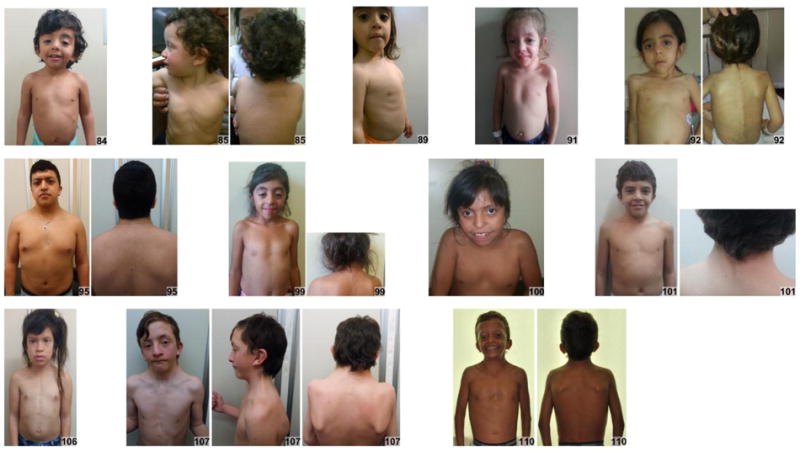
Facial and torso profiles of individuals of Latin American individuals with Noonan syndrome. Gender, age, and country of origin found in Supplementary Table I.
As a more objective measure of phenotype, but limited to facial features, facial analysis technology was applied to 161 individuals (Caucasian, African, Asian, and Latin American) with results shown in Table III. The sensitivity and specificity to discriminate between NS and controls was 0.88 and 0.89, respectively, when the entire cohort was evaluated concurrently. The test accuracy of the facial recognition technology increased significantly when the cohort was analyzed by specific ethnic population (P-value < 0.001 for all comparisons), with sensitivities and specificities for Caucasian, African, Asian, and Latin American of 0.95 and 0.93, 0.94 and 0.91, 0.95 and 0.90, and 0.96 and 0.98, respectively (Table III).
Table III.
Measures of diagnostic accuracy for facial analysis technology that discriminate between Noonan syndrome and unaffected individuals, stratified by different populations.
| Number of Features | AUC | Accuracy | Sensitivity | Specificity | |
|---|---|---|---|---|---|
| Global | 10 | 0.94 | 0.89 | 0.88 | 0.89 |
| Caucasian | 11 | 0.98 | 0.94 | 0.95 | 0.93 |
| African and African American | 5 | 0.94 | 0.93 | 0.94 | 0.91 |
| Asian | 10 | 0.95 | 0.93 | 0.95 | 0.90 |
| Latin American | 6 | 0.97 | 0.97 | 0.96 | 0.98 |
AUC - area under the receiver operating characteristic curve
DISCUSSION
We present the first study that evaluates the clinical presentation of Noonan syndrome and uses facial analysis technology in diverse populations. Both clinical diagnostic guidelines (van der Burgt et al., 1994) and facial analysis technology (Hammond et al., 2004) have been reported for the diagnosis of NS cohorts in the past, but not in multiple ethnic population groups. Hammond et al. used an elaborate combination of deep surface models from three-dimensional scans combined with pattern recognition algorithms to allow for a sensitivity of 88% and specificity of 94% to discriminate between NS and controls (Hammond et al., 2004). However, that study examined only patients of European descent and is not applicable to facial photographs.
In this study, we demonstrate that the clinical presentation of Noonan syndrome is similar across different population groups. When looking at 21 clinical characteristics (Table 1), only two elements where statistically different between the African, Asian, and Latin American groups: ptosis and webbed neck. Three clinical characteristics in our study were present in over 70% of participants including widely spaced eyes (≥80%), low-set ears (>80%), and short stature (>70%).
Experienced clinicians are often able to make a diagnosis of Noonan syndrome by recognizing characteristic facial features of NS. Allanson et al. concluded after subjective clinical exam by two well-trained and experienced clinical geneticists that facial features alone are not sufficient to predict a patient’s genotype due to the presence of atypical features in some of the patients (Allanson et al., 2010). Given the potential difficulties in clinically recognizing Noonan syndrome, especially when the presentation is atypical, facial analysis technology can be a useful complement to the physician’s dysmorphology examination. The facial analysis technology used in our study was able to diagnose patients from all population groups with a sensitivity and specificity of 88% and 89%, respectively (Table III). There was a significant improvement when separately evaluating population groups by the facial analysis algorithm, which led to sensitivity equal to or greater than 94%, and specificity equal or greater than 90% for all groups (Table III). The technology identified quantitative facial biometrics specific to NS for each ethnic group. As expected, our algorithm for facial analysis found widely spaced eyes as a significant facial feature in all ethnic groups (Supplementary Tables III–VI) as well as for the global population (Supplementary Table II).
There are several limitations inherent to studies of genetic syndromes in diverse populations. We acknowledge that ascertainment bias exists with only the most severe phenotypes or those with severe congenital heart disease seeking medical attention. Thus, the milder cases of NS are most likely missed, as seen in adults who are often diagnosed only after their more severely affected child is diagnosed; this is further reinforced by the fact that 30–75% of individuals with NS have an affected parent (Allanson and Roberts 1993). Additionally, in countries with limited resources and access to medical care, molecular genetic testing is difficult compared to developed countries where molecular testing is more widely available. Due to this limitation, we only accepted patients into this study who were diagnosed clinically with NS by a trained clinical geneticist since molecular genetic testing was unavailable in a fraction of our cohort (Supplementary Table I). Another challenge to these studies is arbitrarily grouping populations geographically, for example, Chinese, Indian, and Malaysian in the category of “Asian”. Obviously, every population group is unique, and within countries a significant amount of ethnic diversity and admixture exists. As larger cohorts are assembled through public databases (Muenke et al., 2016), more precise population characterizations will be possible. Additionally, our study does not account for genotype-phenotype correlations which are known to exist, such as pulmonary valve stenosis being more common in individuals with PTPN11 variants (Tartaglia et al., 2002), or hypertrophic cardiomyopathy being more common in those with RIT1 variants (Aoki et al., 2013; Yaoita et al., 2016). However, it is important to note that Allanson et al. 2010 did not find a relationship between genotype and specific facial features in individuals with NS (Allanson et al., 2010). Finally, it is known that the facial features of individuals with NS change over time making potential genotype-phenotype correlations of this disease aspect difficult to assess (Allanson et al., 1985). Even with the above study limitations, our clinical and facial analysis data appear to be consistent and accurate in the evaluation of NS based on the available data. We would like to emphasize that facial analysis technology is a tool and not a substitute for clinical evaluation as it does not consider other important features of Noonan syndrome such as webbed neck, chest deformities, and congenital heart disease.
Lastly, this study and similar reports (Kruszka et al., 2017a; Kruszka et al., 2017b) and our recently created website, www.genome.gov/atlas will have widespread clinical significance for the diagnosis of individuals with NS, especially in countries without access to genetic services or genetic testing where the simplicity of facial analysis technology may be a useful asset.
Supplementary Material
Acknowledgments
We are grateful to the individuals and their families who participated in our study. P.K., Y.A.A, and M.M. are supported by the Division of Intramural Research at the National Human Genome Research Institute, NIH. We thank the Chulalongkorn Academic Advancement Into Its 2nd Century Project. Partial funding of this project was from a philanthropic gift from the Government of Abu Dhabi to the Children’s National Health System. We would like to acknowledge GeneDx and Dr. Benjamin Solomon for providing molecular testing for Noonan syndrome free of charge.
References
- Addissie YA, Kotecha U, Hart RA, Martinez AF, Kruszka P, Muenke M. Craniosynostosis and Noonan syndrome with KRAS mutations: Expanding the phenotype with a case report and review of the literature. Am J Med Genet A. 2015;167A(11):2657–2663. doi: 10.1002/ajmg.a.37259. [DOI] [PubMed] [Google Scholar]
- Allanson JE, Bohring A, Dorr HG, Dufke A, Gillessen-Kaesbach G, Horn D, Konig R, Kratz CP, Kutsche K, Pauli S, Raskin S, Rauch A, Turner A, Wieczorek D, Zenker M. The face of Noonan syndrome: Does phenotype predict genotype. Am J Med Genet A. 2010;152A(8):1960–1966. doi: 10.1002/ajmg.a.33518. [DOI] [PMC free article] [PubMed] [Google Scholar]
- Allanson JE, Hall JG, Hughes HE, Preus M, Witt RD. Noonan syndrome: the changing phenotype. Am J Med Genet. 1985;21(3):507–514. doi: 10.1002/ajmg.1320210313. [DOI] [PubMed] [Google Scholar]
- Allanson JE, Roberts AE. Noonan Syndrome. In: Pagon RA, Adam MP, Ardinger HH, Wallace SE, Amemiya A, Bean LJH, Bird TD, Ledbetter N, Mefford HC, Smith RJH, Stephens K, editors. GeneReviews(R) Seattle (WA): 1993. [Google Scholar]
- Aoki Y, Niihori T, Banjo T, Okamoto N, Mizuno S, Kurosawa K, Ogata T, Takada F, Yano M, Ando T, Hoshika T, Barnett C, Ohashi H, Kawame H, Hasegawa T, Okutani T, Nagashima T, Hasegawa S, Funayama R, Nagashima T, Nakayama K, Inoue S, Watanabe Y, Ogura T, Matsubara Y. Gain-of-function mutations in RIT1 cause Noonan syndrome, a RAS/MAPK pathway syndrome. Am J Hum Genet. 2013;93(1):173–180. doi: 10.1016/j.ajhg.2013.05.021. [DOI] [PMC free article] [PubMed] [Google Scholar]
- Bertola DR, Pereira AC, Albano LM, De Oliveira PS, Kim CA, Krieger JE. PTPN11 gene analysis in 74 Brazilian patients with Noonan syndrome or Noonan-like phenotype. Genet Test. 2006;10(3):186–191. doi: 10.1089/gte.2006.10.186. [DOI] [PubMed] [Google Scholar]
- Bhambhani V, Muenke M. Noonan syndrome. Am Fam Physician. 2014;89(1):37–43. [PMC free article] [PubMed] [Google Scholar]
- Cai D, Zhang C, He X. Unsupervised feature selection for multi-cluster data. Proceedings of the 16th ACM SIGKDD international conference on Knowledge discovery and data mining: ACM. 2010:333–342. [Google Scholar]
- Cerrolaza JJ, Porras AR, Mansoor A, Zhao Q, Summar M, Linguraru MG. Identification of dysmorphic syndromes using landmark-specific local texture descriptors. Biomedical Imaging (ISBI), 2016 IEEE 13th International Symposium on: IEEE. 2016:1080–1083. [Google Scholar]
- Cortes C, Vapnik V. Support-vector networks. Machine learning. 1995;20(3):273–297. [Google Scholar]
- Edwards JJ, Martinelli S, Pannone L, Lo IF, Shi L, Edelmann L, Tartaglia M, Luk HM, Gelb BD. A PTPN11 allele encoding a catalytically impaired SHP2 protein in a patient with a Noonan syndrome phenotype. Am J Med Genet A. 2014;164A(9):2351–2355. doi: 10.1002/ajmg.a.36620. [DOI] [PMC free article] [PubMed] [Google Scholar]
- Elisseeff A, Pontil M. Leave-one-out error and stability of learning algorithms with applications. NATO science series sub series iii computer and systems sciences. 2003;190:111–130. [Google Scholar]
- Essawi ML, Ismail MF, Afifi HH, Kobesiy MM, El Kotoury A, Barakat MM. Mutational analysis of the PTPN11 gene in Egyptian patients with Noonan syndrome. J Formos Med Assoc. 2013;112(11):707–712. doi: 10.1016/j.jfma.2012.06.002. [DOI] [PubMed] [Google Scholar]
- Hammond P, Hutton TJ, Allanson JE, Campbell LE, Hennekam RC, Holden S, Patton MA, Shaw A, Temple IK, Trotter M, Murphy KC, Winter RM. 3D analysis of facial morphology. Am J Med Genet A. 2004;126A(4):339–348. doi: 10.1002/ajmg.a.20665. [DOI] [PubMed] [Google Scholar]
- Hung CS, Lin JL, Lee YJ, Lin SP, Chao MC, Lo FS. Mutational analysis of PTPN11 gene in Taiwanese children with Noonan syndrome. J Formos Med Assoc. 2007;106(2):169–172. doi: 10.1016/S0929-6646(09)60235-7. [DOI] [PubMed] [Google Scholar]
- Isojima T, Sakazume S, Hasegawa T, Ogata T, Nakanishi T, Nagai T, Yokoya S. Growth references for Japanese individuals with Noonan syndrome. Pediatr Res. 2016;79(4):543–548. doi: 10.1038/pr.2015.254. [DOI] [PubMed] [Google Scholar]
- Jongmans M, Sistermans EA, Rikken A, Nillesen WM, Tamminga R, Patton M, Maier EM, Tartaglia M, Noordam K, van der Burgt I. Genotypic and phenotypic characterization of Noonan syndrome: new data and review of the literature. Am J Med Genet A. 2005;134A(2):165–170. doi: 10.1002/ajmg.a.30598. [DOI] [PubMed] [Google Scholar]
- Ko JM, Kim JM, Kim GH, Yoo HW. PTPN11, SOS1, KRAS, and RAF1 gene analysis, and genotype-phenotype correlation in Korean patients with Noonan syndrome. J Hum Genet. 2008;53(11–12):999–1006. doi: 10.1007/s10038-008-0343-6. [DOI] [PubMed] [Google Scholar]
- Kruszka P, Addissie YA, McGinn DE, Porras AR, Biggs E, Share M, Crowley TB, Chung BH, Mok GT, Mak CC, Muthukumarasamy P, Thong MK, Sirisena ND, Dissanayake VH, Paththinige CS, Prabodha LB, Mishra R, Shotelersuk V, Ekure EN, Sokunbi OJ, Kalu N, Ferreira CR, Duncan JM, Patil SJ, Jones KL, Kaplan JD, Abdul-Rahman OA, Uwineza A, Mutesa L, Moresco A, Obregon MG, Richieri-Costa A, Gil-da-Silva-Lopes VL, Adeyemo AA, Summar M, Zackai EH, McDonald-McGinn DM, Linguraru MG, Muenke M. 22q11.2 deletion syndrome in diverse populations. Am J Med Genet A. 2017a;173(4):879–888. doi: 10.1002/ajmg.a.38199. [DOI] [PMC free article] [PubMed] [Google Scholar]
- Kruszka P, Porras AR, Sobering AK, Ikolo FA, La Qua S, Shotelersuk V, Chung BH, Mok GT, Uwineza A, Mutesa L, Moresco A, Obregon MG, Sokunbi OJ, Kalu N, Joseph DA, Ikebudu D, Ugwu CE, Okoromah CA, Addissie YA, Pardo KL, Brough JJ, Lee NC, Girisha KM, Patil SJ, Ng IS, Min BC, Jamuar SS, Tibrewal S, Wallang B, Ganesh S, Sirisena ND, Dissanayake VH, Paththinige CS, Prabodha LB, Richieri-Costa A, Muthukumarasamy P, Thong MK, Jones KL, Abdul-Rahman OA, Ekure EN, Adeyemo AA, Summar M, Linguraru MG, Muenke M. Down syndrome in diverse populations. Am J Med Genet A. 2017b;173(1):42–53. doi: 10.1002/ajmg.a.38043. [DOI] [PubMed] [Google Scholar]
- Lee A, Sakhalkar MV. Ocular manifestations of Noonan syndrome in twin siblings: a case report of keratoconus with acute corneal hydrops. Indian J Ophthalmol. 2014;62(12):1171–1173. doi: 10.4103/0301-4738.126992. [DOI] [PMC free article] [PubMed] [Google Scholar]
- Lee BH, Kim JM, Jin HY, Kim GH, Choi JH, Yoo HW. Spectrum of mutations in Noonan syndrome and their correlation with phenotypes. J Pediatr. 2011;159(6):1029–1035. doi: 10.1016/j.jpeds.2011.05.024. [DOI] [PubMed] [Google Scholar]
- Lee ST, Ki CS, Lee HJ. Mutation analysis of the genes involved in the Ras-mitogen-activated protein kinase (MAPK) pathway in Korean patients with Noonan syndrome. Clin Genet. 2007;72(2):150–155. doi: 10.1111/j.1399-0004.2007.00839.x. [DOI] [PubMed] [Google Scholar]
- Malaquias AC, Brasil AS, Pereira AC, Arnhold IJ, Mendonca BB, Bertola DR, Jorge AA. Growth standards of patients with Noonan and Noonan-like syndromes with mutations in the RAS/MAPK pathway. Am J Med Genet A. 2012;158A(11):2700–2706. doi: 10.1002/ajmg.a.35519. [DOI] [PubMed] [Google Scholar]
- Muenke M, Adeyemo A, Kruszka P. An electronic atlas of human malformation syndromes in diverse populations. Genet Med. 2016;18:1085–1087. doi: 10.1038/gim.2016.3. [DOI] [PubMed] [Google Scholar]
- Ndiaye R, Ndiaye C, Leye M, Mbengue B, Diallo MS, Diop JPD, Faye O, Diop IB, Sy HS. Mutation N308T of protein tyrosine phosphatase SHP-2 in two Senegalese patients with Noonan syndrome. J Med Genet Genom. 2014;6(1):6–10. [Google Scholar]
- Noonan JA. Hypertelorism with Turner phenotype. A new syndrome with associated congenital heart disease. Am J Dis Child. 1968;116(4):373–380. doi: 10.1001/archpedi.1968.02100020377005. [DOI] [PubMed] [Google Scholar]
- Ojala T, Pietikäinen M, Harwood D. A comparative study of texture measures with classification based on featured distributions. Pattern recognition. 1996;29(1):51–59. [Google Scholar]
- Roberts AE, Allanson JE, Tartaglia M, Gelb BD. Noonan syndrome. Lancet. 2013;381(9863):333–342. doi: 10.1016/S0140-6736(12)61023-X. [DOI] [PMC free article] [PubMed] [Google Scholar]
- Roberts AE, Araki T, Swanson KD, Montgomery KT, Schiripo TA, Joshi VA, Li L, Yassin Y, Tamburino AM, Neel BG, Kucherlapati RS. Germline gain-of-function mutations in SOS1 cause Noonan syndrome. Nat Genet. 2007;39(1):70–74. doi: 10.1038/ng1926. [DOI] [PubMed] [Google Scholar]
- Romano AA, Allanson JE, Dahlgren J, Gelb BD, Hall B, Pierpont ME, Roberts AE, Robinson W, Takemoto CM, Noonan JA. Noonan syndrome: clinical features, diagnosis, and management guidelines. Pediatrics. 2010;126(4):746–759. doi: 10.1542/peds.2009-3207. [DOI] [PubMed] [Google Scholar]
- Simsek-Kiper PO, Alanay Y, Gulhan B, Lissewski C, Turkyilmaz D, Alehan D, Cetin M, Utine GE, Zenker M, Boduroglu K. Clinical and molecular analysis of RASopathies in a group of Turkish patients. Clin Genet. 2013;83(2):181–186. doi: 10.1111/j.1399-0004.2012.01875.x. [DOI] [PubMed] [Google Scholar]
- Tartaglia M, Kalidas K, Shaw A, Song X, Musat DL, van der Burgt I, Brunner HG, Bertola DR, Crosby A, Ion A, Kucherlapati RS, Jeffery S, Patton MA, Gelb BD. PTPN11 mutations in Noonan syndrome: molecular spectrum, genotype-phenotype correlation, and phenotypic heterogeneity. Am J Hum Genet. 2002;70(6):1555–1563. doi: 10.1086/340847. [DOI] [PMC free article] [PubMed] [Google Scholar]
- Tartaglia M, Mehler EL, Goldberg R, Zampino G, Brunner HG, Kremer H, van der Burgt I, Crosby AH, Ion A, Jeffery S, Kalidas K, Patton MA, Kucherlapati RS, Gelb BD. Mutations in PTPN11, encoding the protein tyrosine phosphatase SHP-2, cause Noonan syndrome. Nat Genet. 2001;29(4):465–468. doi: 10.1038/ng772. [DOI] [PubMed] [Google Scholar]
- Tartaglia M, Pennacchio LA, Zhao C, Yadav KK, Fodale V, Sarkozy A, Pandit B, Oishi K, Martinelli S, Schackwitz W, Ustaszewska A, Martin J, Bristow J, Carta C, Lepri F, Neri C, Vasta I, Gibson K, Curry CJ, Siguero JP, Digilio MC, Zampino G, Dallapiccola B, Bar-Sagi D, Gelb BD. Gain-of-function SOS1 mutations cause a distinctive form of Noonan syndrome. Nat Genet. 2007;39(1):75–79. doi: 10.1038/ng1939. [DOI] [PubMed] [Google Scholar]
- van der Burgt I, Berends E, Lommen E, van Beersum S, Hamel B, Mariman E. Clinical and molecular studies in a large Dutch family with Noonan syndrome. Am J Med Genet. 1994;53(2):187–191. doi: 10.1002/ajmg.1320530213. [DOI] [PubMed] [Google Scholar]
- van der Burgt I, Thoonen G, Roosenboom N, Assman-Hulsmans C, Gabreels F, Otten B, Brunner HG. Patterns of cognitive functioning in school-aged children with Noonan syndrome associated with variability in phenotypic expression. J Pediatr. 1999;135(6):707–713. doi: 10.1016/s0022-3476(99)70089-2. [DOI] [PubMed] [Google Scholar]
- Yaoita M, Niihori T, Mizuno S, Okamoto N, Hayashi S, Watanabe A, Yokozawa M, Suzumura H, Nakahara A, Nakano Y, Hokosaki T, Ohmori A, Sawada H, Migita O, Mima A, Lapunzina P, Santos-Simarro F, Garcia-Minaur S, Ogata T, Kawame H, Kurosawa K, Ohashi H, Inoue S, Matsubara Y, Kure S, Aoki Y. Spectrum of mutations and genotype-phenotype analysis in Noonan syndrome patients with RIT1 mutations. Hum Genet. 2016;135(2):209–222. doi: 10.1007/s00439-015-1627-5. [DOI] [PubMed] [Google Scholar]
- Ye J, Janardan R, Li Q. Two-Dimensional Linear Discriminant Analysis. NIPS. 2004:4. [Google Scholar]
- Yoshida R, Hasegawa T, Hasegawa Y, Nagai T, Kinoshita E, Tanaka Y, Kanegane H, Ohyama K, Onishi T, Hanew K, Okuyama T, Horikawa R, Tanaka T, Ogata T. Protein-tyrosine phosphatase, nonreceptor type 11 mutation analysis and clinical assessment in 45 patients with Noonan syndrome. J Clin Endocrinol Metab. 2004;89(7):3359–3364. doi: 10.1210/jc.2003-032091. [DOI] [PubMed] [Google Scholar]
- Zhao Q, Okada K, Rosenbaum K, Kehoe L, Zand DJ, Sze R, Summar M, Linguraru MG. Digital facial dysmorphology for genetic screening: Hierarchical constrained local model using ICA. Med Image Anal. 2014a;18(5):699–710. doi: 10.1016/j.media.2014.04.002. [DOI] [PubMed] [Google Scholar]
- Zhao Q, Okada K, Rosenbaum K, Zand DJ, Sze R, Summar M, Linguraru MG. Hierarchical constrained local model using ICA and its application to Down syndrome detection. Med Image Comput Comput Assist Interv. 2013;16(Pt 2):222–229. doi: 10.1007/978-3-642-40763-5_28. [DOI] [PubMed] [Google Scholar]
- Zhao Q, Werghi N, Okada K, Rosenbaum K, Summar M, Linguraru MG. Ensemble learning for the detection of facial dysmorphology. Conf Proc IEEE Eng Med Biol Soc. 2014b;2014:754–757. doi: 10.1109/EMBC.2014.6943700. [DOI] [PubMed] [Google Scholar]
Associated Data
This section collects any data citations, data availability statements, or supplementary materials included in this article.


