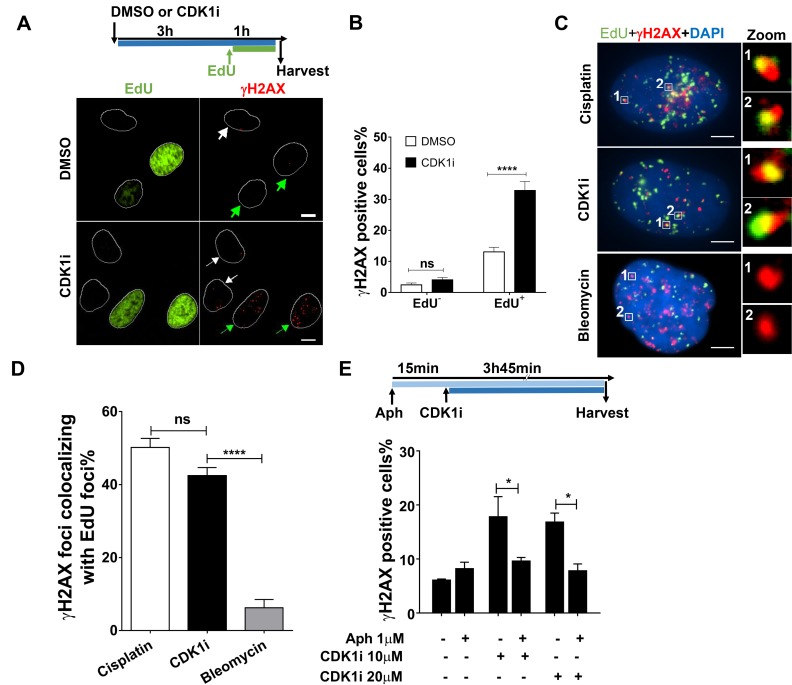
Figure 2. CDK1 inhibition induces a DNA damage response mainly in replicating cells.
A. Representative immunofluorescence images of γH2AX foci in DMSO- or CDK1i-treated U2OS cells. EdU staining was used to label replicating cells. White and green arrows denote non-replicating cells and replicating cells, respectively, and white circles are outlines of cell nuclei. An experimental scheme is shown at the top. Scale bar, 10 µm; B. Quantification of γH2AX foci in EdU-negative and -positive U2OS cells treated as indicated in A. C. Representative images of single cell-based analysis of colocalization of γH2AX foci and replication sites marked by EdU after the indicated treatment according to the scheme shown in A, insets on the right side are enlarged images of colocalization of γH2AX foci to EdU foci. Scale bar, 5 µm. D. Quantification of the percentage of γH2AX foci colocalizing with EdU foci in cells from C., cisplatin and bleomycin were used as the positive and negative controls, respectively, and at least 30 individual cells were analyzed for each group. E. Quantification of γH2AX foci in U2OS cells treated with or without CDK1i in the absence or presence of aphidicolin. The experimental scheme is shown at the top. Data were obtained from three independent experiments and are presented as the means±SEM. To calculate significance, a two-way ANOVA followed by a Sidak multiple comparison post-test was used for B. and E., and a one-way ANOVA followed by Dunnett’s multiple comparison post-test was performed for D. *, p < 0.05; ****, p < 0.0001; ns, not significant.

