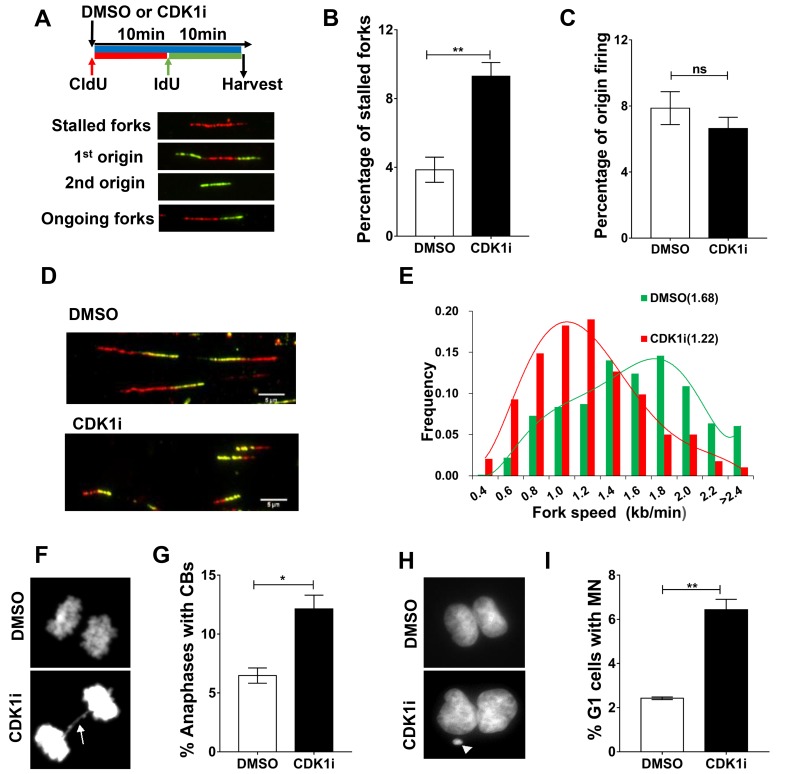
Figure 4. CDK1 inhibition leads to increased replication fork stalling and elevated genomic instability.
A. Replication fork analysis of U2OS cells pulsed with the thymidine analogs chlorodeoxyuridine (CldU) and iododeoxyuridine (IdU) in the presence of DMSO or CDK1i. An experimental scheme for DNA fiber assay (A., top), typical replication structures (A., bottom) are shown. B.-C. Quantification of the percentage of stalled forks B. and new origin firing C. in cells from A. D. Representative images of ongoing replication forks in U2OS cells treated with or without CDK1i (scale bar, 5 µm). E. Quantification of fork speed (numbers in the parentheses denote average fork speed) in cells from D (n = 4 independent experiments). In B and D, results are presented as the means±SEM. F.-G. Representative images F. and quantification G. of anaphases containing chromosome bridges (CBs) in U2OS cells treated with DMSO or 7 μM RO3306 for 16 hours, the white arrow denotes a typical chromatin bridge. H.-I. Representative images H. and quantification I. of G1 daughter pairs containing micronuclei (MN) from cells treated as described in F. The white arrow denotes a representative micronucleus. Data are presented as the means±SEM from three independent experiments, and at least 1000 anaphases or G1 daughter pairs were counted. Student’s t-tests were performed to calculate p values. *, p < 0.05; **, p < 0.01; ns, not significant.

