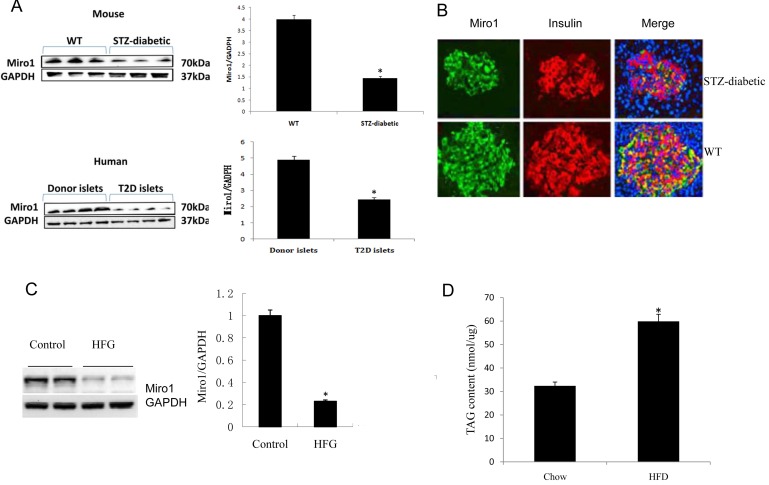
Figure 1.
A. The protein level of Miro1 in islet samples from diabetic mouse model and biopsy patients with T2D. Miro1 expression was normalized to that of GAPDH (n = 4 for normal and 7 for T2D samples, *P < 0.05 versus control). B. The distribution of the Miro1 within islet cells from STZ-diabetic mouse model was analyzed using confocal microscopy. C. Miro1 protein expression in the islet of mice subjected to an HFD for 24 weeks and in NC controls (n = 5 samples per experimental group, *P < 0.05 compared with the NC group). GAPDH served as a loading control D. TAG contents in the islet of mice subjected to an HFD for 24 weeks and in NC controls (n = 6 samples per experimental group, *P < 0.05 versus control). The data represent as the mean±SD. Statistical analysis was carried out by Student’s two-tailed t-test.

