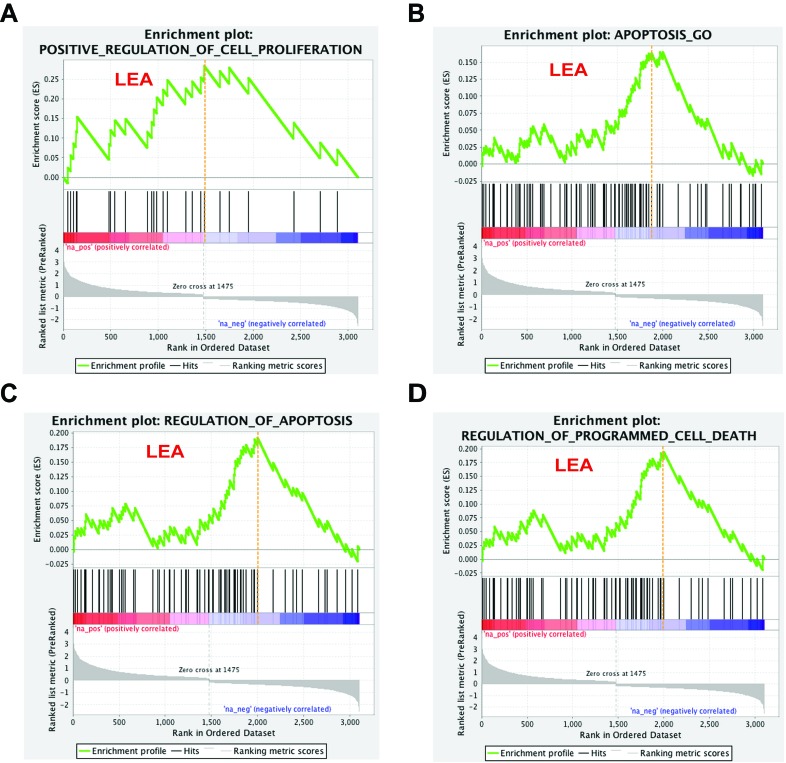
Figure 3. Cell proliferation and apoptosis related gene sets response to 16L2 expression.
Enrichment plots for four selected gene sets are shown as above. Gene sets are selected based on their biological functions, GSEA p-values, and FDR q-values (p < 0.05, and FDR<0.1). Green line indicates accumulative enrichment score; black lines show ranking location of genes with gene set; gray color visualizes ranking metric scores; red and blue gradient colors suggest a positive or a negative regulation, respectively; and hits on the left side of orange dash lines are considered within leading edge subset (labeled LEA).

