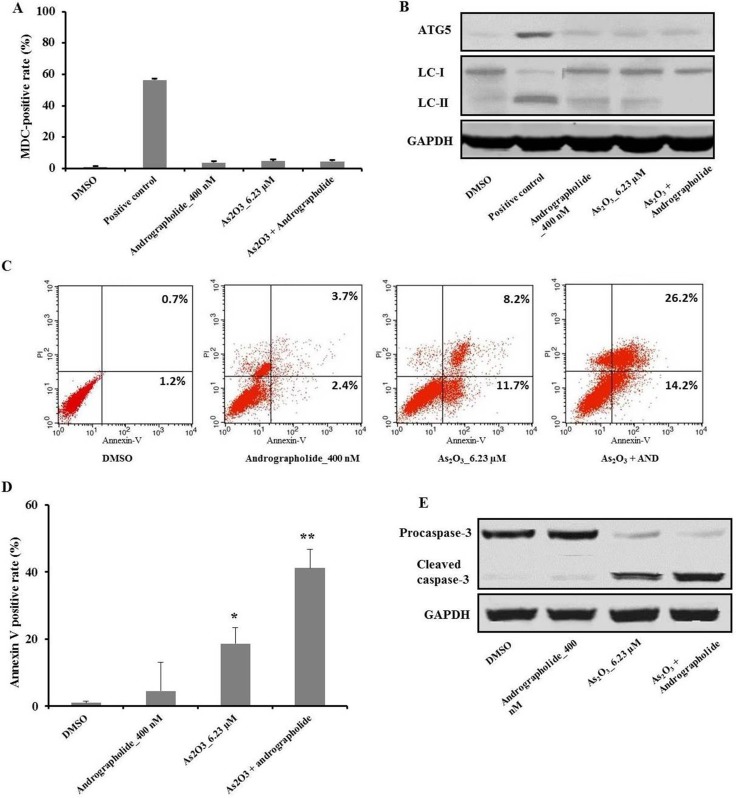
Figure 2. Andrographolide increased As2O3-induced apoptosis in HepG2 cells, which was independent of autophagy.
(A) HepG2 cells were treated with the indicated treatments for 48 h, and then incubated with MDC at 0.05 mM for 10 min at 37°C. After washing twice with PBS, the cells were immediately analyzed by flow cytometry. (B) The levels of Atg-5 and LC-3 were analyzed using western blot. (C–D) The cells were treated with the indicated treatments and, after an additional incubation for 48 h, the cells were stained with Annexin V and PI. Apoptotic cells were analyzed using flow cytometry. The fraction of viable cells: Annexin V−, PI−; lower left quadrant. Necrotic cells: Annexin V−, PI−; upper left; of early apoptotic cells: Annexin V−, PI−; lower right; of late apoptotic cells: Annexin V−, PI−. (E) The level of cleaved caspase-3 was analyzed by western blot. Each experiment was repeated independently more than three times. *P < 0.05, **P < 0.01 by two-tailed t-test.

