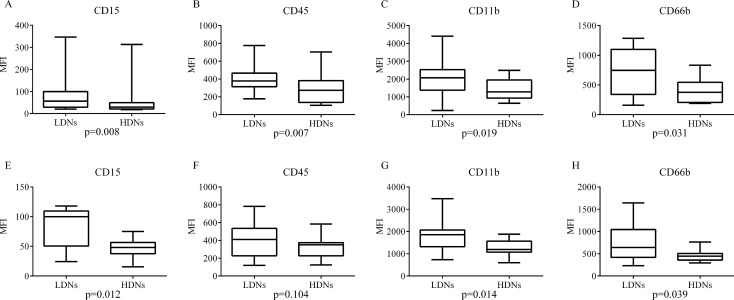
Figure 1. Expression levels of four surface CD molecules in LDNs and HDNs.
LDNs and HDNs from untreated patients (A–D) and healthy controls (E–H) were detected by flow cytometry for expression level of CD15, CD45, CD11b and CD66b. Statistical significance was determined by a two-tailed Mann-Whitney test. Box = interquartile range and median; whiskers = range.

