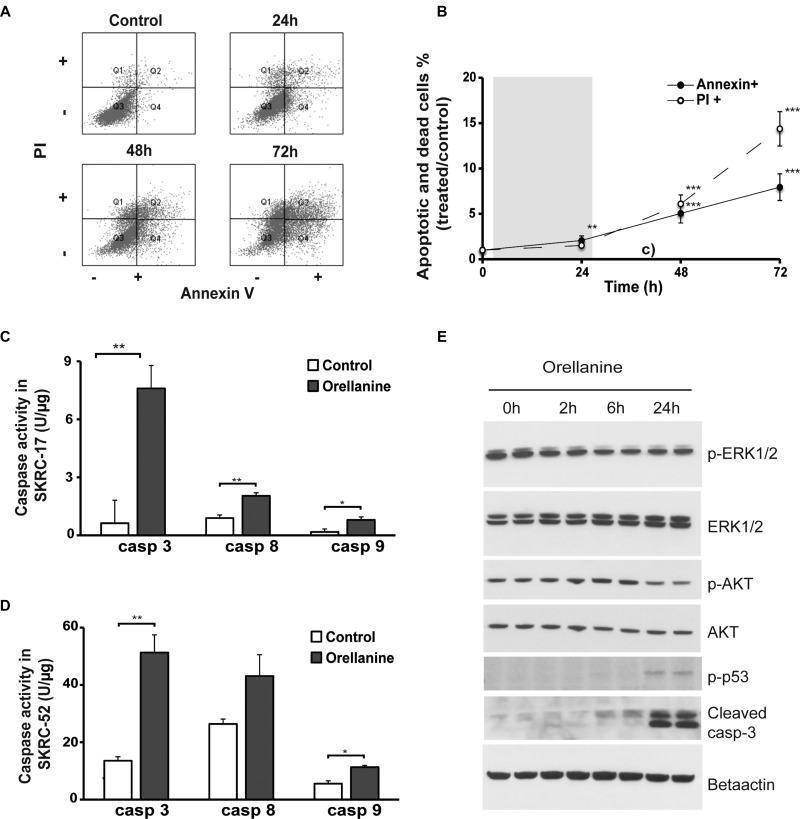
Figure 3. Orellanine promotes cell death in clear cell renal carcinoma cells.
(A) FACS scatter plots of vehicle or orellanine-treated SKRC-52 cells, treated for 24 hours with 100 μg orellanine/ml and analyzed 24, 48 and 72 hours post treatment initiation, for the presence of Annexin V and/or PI (n = 12, 9, 8 and 8 for controls, 24 h, 48 h and 72 h respectively). (B) The FACS plot presented graphically. PI indicates the cells in Q1 of Figure 3A (Necrosis). Annexin indicates PI+Annexin (late apoptosis) and Annexin (Early apoptosis), i.e. panel Q2 and Q4 in Figure 3A. Data are presented as mean +/- SEM and p values are determined by ANOVA with Tukey's post hoc test where p < 0.05 was considered significant. **p < 0.01, ***p < 0.001. Caspase 3, 8 and 9 activity in (C) SKRC-17 cells and (D) SKRC-52 cells treated with vehicle or 100 μg orellanine/ml for 24 hours, (n = 3, mean ± SEM, students t-test, *p < 0.05, **p < 0.01) (E) Western blots showing duplicate samples of total protein and phosphorylated p44/p42 MAPK (ERK1/2) (Thr202/Tyr204), AKT (Ser473), p53 (Ser15) and cleaved caspase-3 following 100 μg/ml orellanine exposure for 0, 2, 6 or 24 h. Beta actin served as a loading control.

