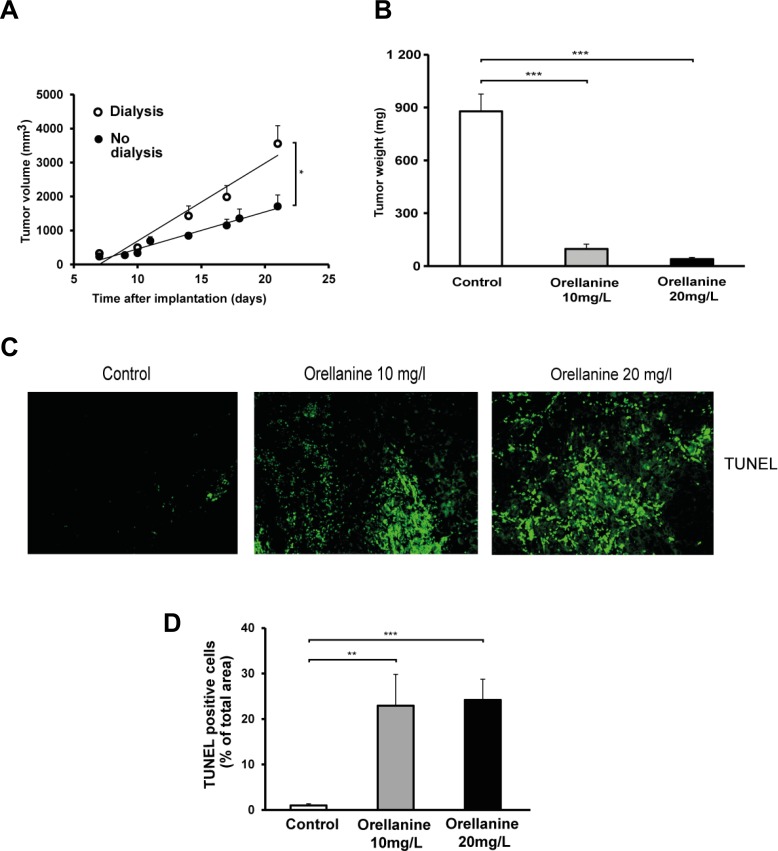
Figure 7. Orellanine-treated tumors are considerably smaller and display an evident increase in apoptosis.
(A) Tumor volume in RNU-rats, with or without one 15ml cycle of dialysis per day, irradiated with 4 gray 4 days pre implantation of SKRC-17 cells subcutaneously (n = 6). (B) Tumor weight of vechicle treated control tumors (n = 5) and tumors exposed to orellanine for 5 days (10 mg/L, n = 5) or 3 days (20 mg/L, n = 5). (C) TUNEL staining in tumor sections. From left; control, 10 mg/L orellanine-treated tumors and 20 mg/L orellanine-treated tumors. (D) Diagram showing TUNEL-positive cells in tumor sections (n = 25 for each concentration and n = 20 for control sections) from control tumors and tumors treated with 10 mg/L or 20 mg/L of orellanine. Data are presented as mean ± SEM and p-values are determined by one way ANOVA with Tukey’s post hoc test, where *p < 0.05 was considered significant. **p < 0.01, ***p < 0.001.

