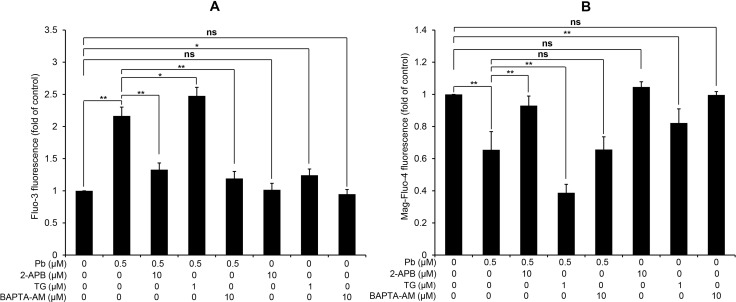
Figure 2. Modulation of [Ca2+]c and [Ca2+]ER by three regulators of Ca2+ signaling in rPT cells.
Cells were treated with 0.5 µM Pb for 12 h in the presence or absence of 10 µM 2-APB (co-incubation for the entire course), 1 µM TG (co-incubation for the entire course) and 10 µM BAPTA-AM (30 min pre-incubation before Pb treatment) to assess the changes of [Ca2+]c and [Ca2+]ER, assessed by flow cytometry. Values of fluorescence intensity of Fluo-3 (A) and Mag-Fluo-4 (B) are quantified in a relative way to its respective control, whose value is set at one. Data represent mean ± SEM (n = 6). ns not significant, *P < 0.05, **P < 0.01.

