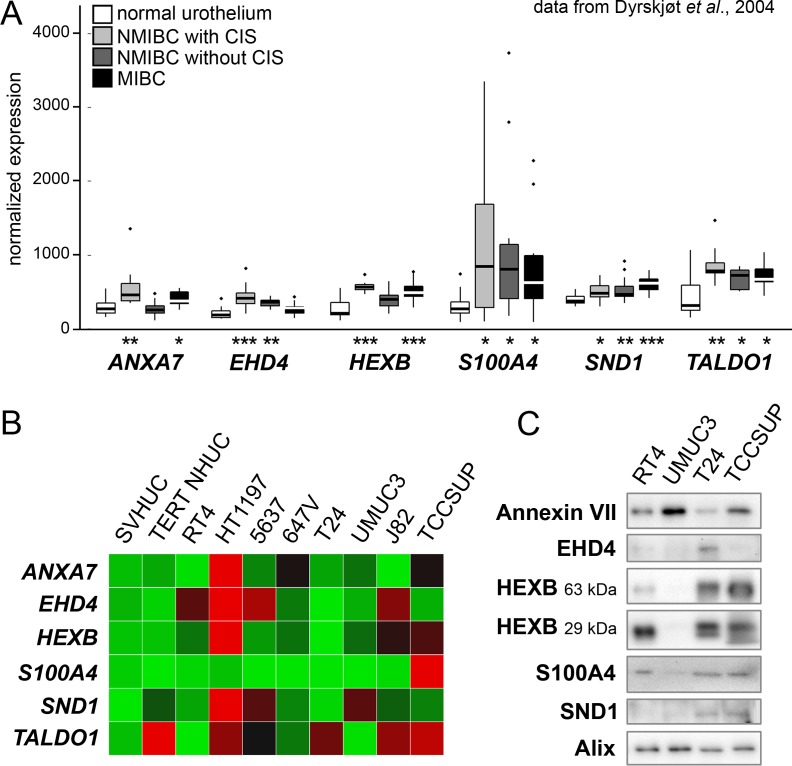
Figure 2. Examination of candidate EV proteins in patient and cell line arrays.
(A) A bladder cancer gene expression microarray dataset published by Dyrskjøt et al. was used to screen possible candidates. Six genes were found to be over-expressed in one or more cancer types. Significance of over-expression compared to normal tissue samples is represented by asterisks (* is P < 0.05, ** is P < 0.01, *** is P < 0.001). (B) Expression heat map showing qPCR measurement of seven candidate mRNAs plus EDIL3 in a panel of eight bladder cancer cell lines and two normal urothelial lines (SVHUC and TERT-NHUC). Red = high expression. (C) Western blot analysis of EVs derived from four bladder cancer cell lines. HEXB bands are predicted at two distinct protein sizes. EV marker Alix was used as a loading control.

