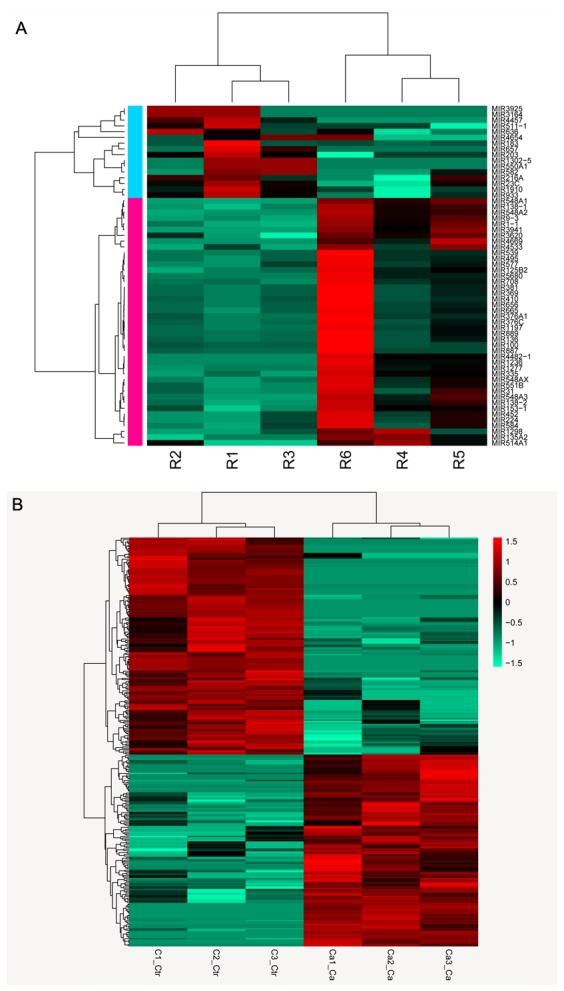
Figure 1. Heatmap of RNA sequencing data.

(A) Expression profiles of differentially expressed miRNAs in patients and controls; (B) Expression profiles of differentially expressed circRNAs in patients and controls

(A) Expression profiles of differentially expressed miRNAs in patients and controls; (B) Expression profiles of differentially expressed circRNAs in patients and controls