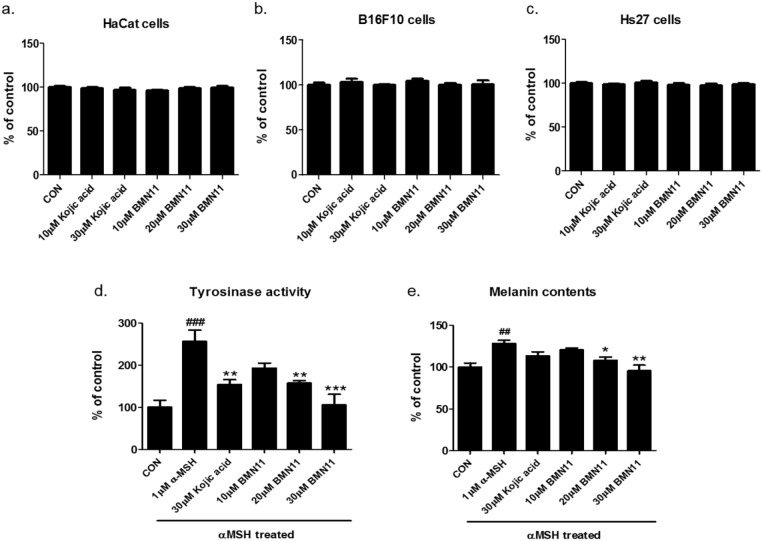
Figure 4. Inhibition of melanin accumulation by BMN11 in B16F10 cells.
(a-c) Cell viability post BMN11 treatment. (a) HaCat, (b) B16F10, or (c) Hs27 cells were exposed to BMN11 at various concentrations for 48 h, as shown in this figure. The MTT analysis was then performed. The results are shown as the percentages relative to the non-treated group (n = 5/group). (d-e) αMSH–induced tyrosinase activity and melanin accumulation in B16F10 cells post BMN11 treatments. B16F10 cells were pre-treated with BMN11 or kojic acid for 2 h. The cells were exposed to αMSH (1 μM) for 48 h to induce melanogenesis (n = 4/group). (d) Tyrosinase activity and (e) melanin content were measured using a microplate reader (n = 4/each group). The data are expressed as means ± SEM. ##P < 0.01 and ###P < 0.001 compared with the non-treated control group. *P < 0.05, **P < 0.01, and ***P < 0.001 compared to the αMSH-exposed group.

