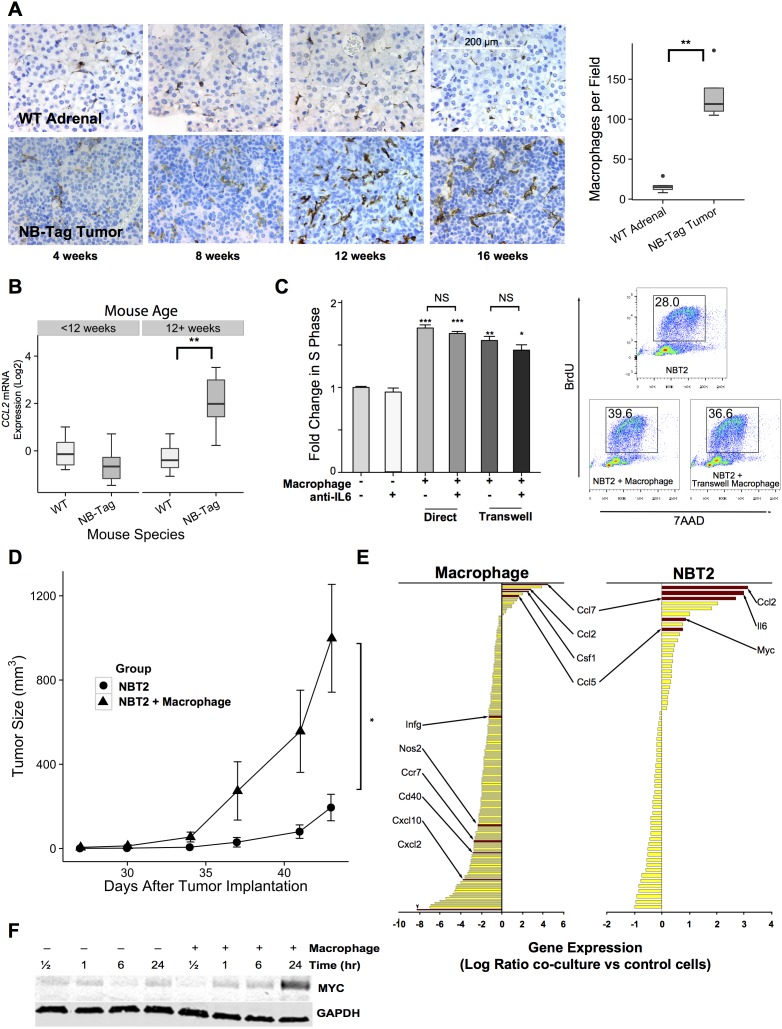
Figure 1. TAM infiltration in NB-Tag tumors is associated with tumor proliferation and induction of MYC expression.
(A) Left: Representative immunohistochemical images of macrophages (detected using anti-F4/80 antibody) in the adrenal medulla of WT mice and in tumors arising from adrenal glands of NB-Tag mice at various ages; Right: Boxplots of macrophage counts (F4/80+ cells) from IHC images of mice >12 weeks of age compared to age-matched adrenal medulla. (At least 5 fields from each tumor or adrenal gland section per specimen and 4-6 specimens per group were analyzed) (** p <0.005); (B) Boxplot of CCL2 gene expression levels measured by RT-PCR comparing NB-Tag tumors versus WT adrenal glands in mice < 12 weeks of age and > 12 weeks of age (n = 6 per group) (** p < 0.005); (C) Left: Mean fold change (+SD) in S phase frequency, as measured by BrDU incorporation, of NBT2 cells cultured with and without macrophages in direct contact or in transwell plates and in the presence or absence of anti-IL-6 neutralizing antibody (10 μg/ml). Macrophages were gated out of analyses according to staining for CD45. Data were compiled from at least 3 independent experiments in triplicates (* p < 0.05, ** p < 0.005, *** p < 0.0005); Right: Representative flow cytometry profile of incorporation of BrdU in NBT2 cells as measured in various experimental designs; (D) Tumor growth in NSG mice injected with 1x100 NBT2 tumor cells alone in one shoulder or co-injected with equal numbers of macrophages in the opposite shoulder (macrophages were conditioned for 24-36 hours with NBT2 cells in the transwell system) (n = 4 mice per group, * ANOVA p = 0.03); (E) Average fold change in gene expression levels (using Nanostring Mouse Inflammation Kit) of tumor-conditioned macrophages compared to peritoneal macrophages (left panel) and of NBT2 cells cultured with macrophages compared to naïve NBT2 cells (right panel) (data obtained from three independent experiments); (F) Expression levels of MYC protein in lysates of NBT2 cells cultured in transwells with or without macrophages as analyzed by immunoblotting.

