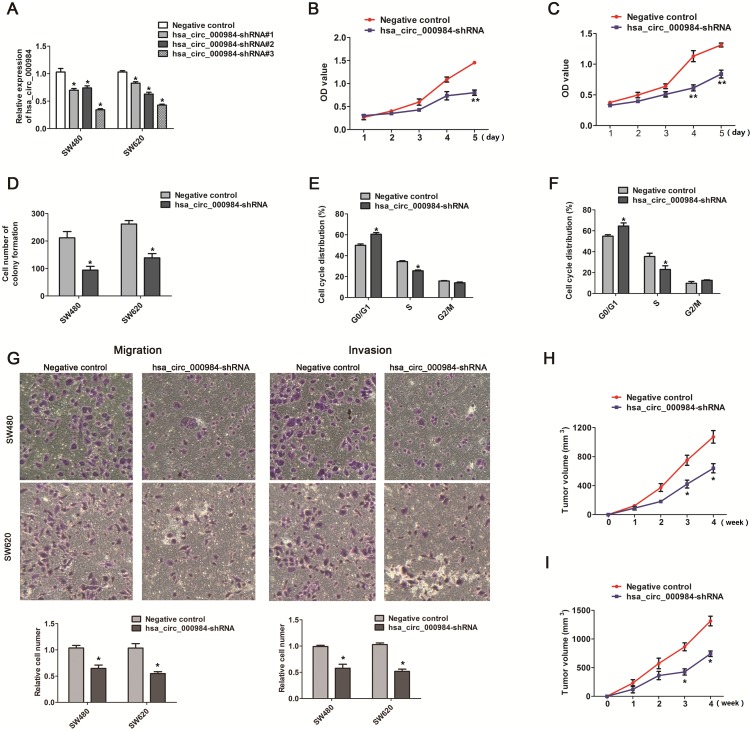
Figure 2. The effect of hsa_circ_000984 on cell proliferation, migration, invasion and tumor formation.
(A) qRT-PCR analysis of knockdown efficiency of hsa_circ_000984 in SW480 and SW620 cells transfected with shRNAs (shRNA#1, shRNA#2 and shRNA#3) targeting hsa_circ_000984 or a control shRNA (Negative control). Data are shown as mean ± SD for three independent experiments (n=3). *P<0.05, two-side Student’s t-test. (B and C) CCK-8 assay showed that CRC cells with stable expressing hsa_circ_000984 shRNA grew slower compared to the controls. **P<0.001, two-side Student’s t-test. Data are shown as mean ± SD for three independent experiments (n=3). (D) Colony formation assay showed that the knockdown of hsa_circ_000984 in CRC cells evidently reduced the numbers of colonies. (E) SW480 and (F) SW620 cells with stable expressing hsa_circ_000984 shRNA were mainly arrested in G0/G1 phase. (G) Migration and invasion assays for CRC cells with stable expressing hsa_circ_000984 shRNA and negative control. *P<0.05, two-side Student’s t-test. Data are shown as mean ± SD for three independent experiments (n=3). (H) SW480 and (I) SW620 cells with stable expressing hsa_circ_000984 shRNA were subcutaneously implanted in nude mice (n=8/group), and there was a statistical significance of tumor size between hsa_circ_000984 knockdown groups and control groups in the 28th day. *P<0.05, two-side Student’s t-test. All data indicate mean ±SD.

