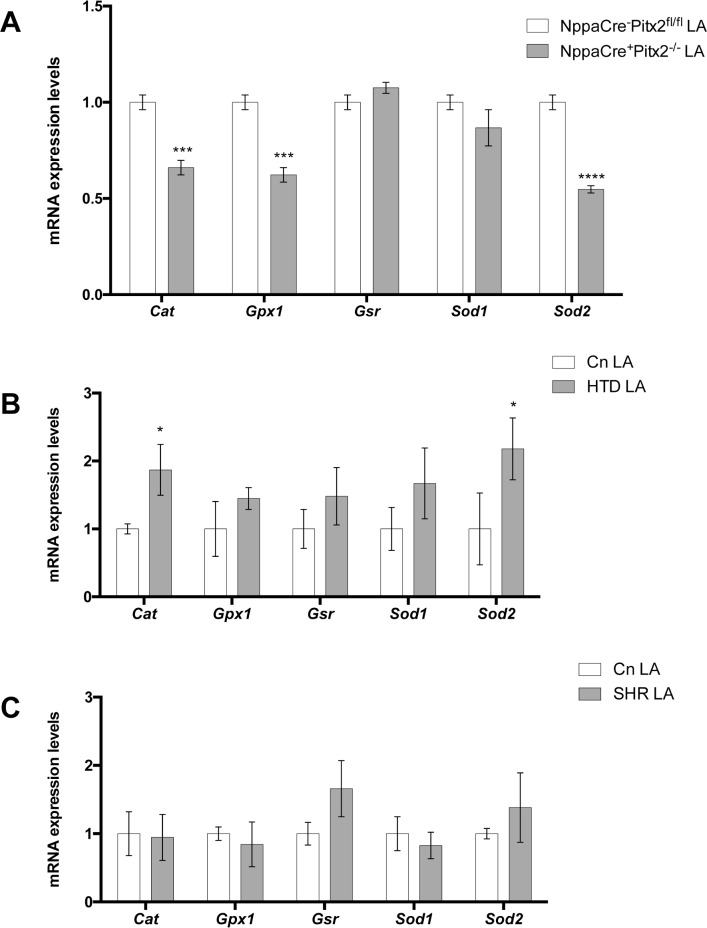
Fig 4.
Redox signaling gene expression analyses of adult left atria (LA) corresponding to NppaCre+Pitx2-/- (A), HTD (B) and SHR (C), respectively, as compared to their corresponding controls. Note that Cat, Gpx1 and Sod2 are significantly decreased in NppaCre+Pitx2-/- as compared to NppaCre-Pitx2fl/fl controls, Cat and Sod2 are significantly increased in HTD mice whereas no changes are observed in SHR mice. In all cases, n = 6. *p<0.01, ***p<0.001, ****p<0.0001.

