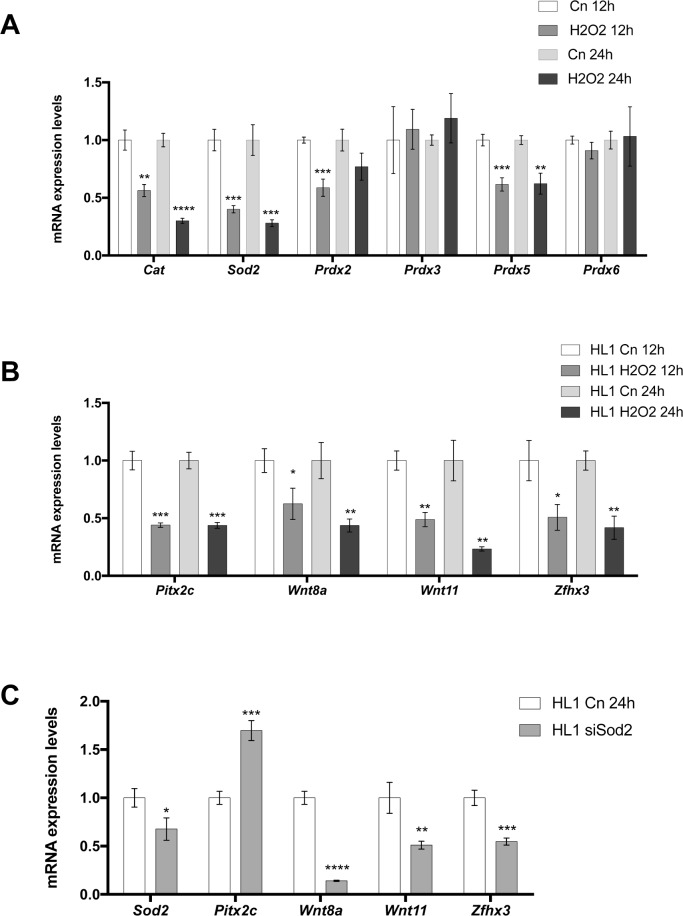
Fig 6.
(A) Redox signaling gene expression analyses of H202 treated HL-1 atrial cardiomyocytes at 12 h and 24h. Observe that Cat, Sod2 and Prdx5 are significantly decreased at 12h and 24h after H202 administration, whereas Prdx2 is only decreased at 12h but not at 24h. (B) Gene expression analyses of Pitx2c, Wnt8a, Wnt11 and Zfhx3 after H202 administration. Observe that all of them are significantly decreased at 12h and 24h. (C) Gene expression analyses in Sod2 silenced HL-1 atrial cardiomyocytes. Note that Sod2 is decreased (siSod2), Pitx2c increases whereas Wnt8a, Wnt11 and Zfhx3 are significantly decreased. Representative values of three pooled replicates on three independent biological transfections. *p<0.01, **p<0.05, ***p<0.001, ****p<0.0001.

