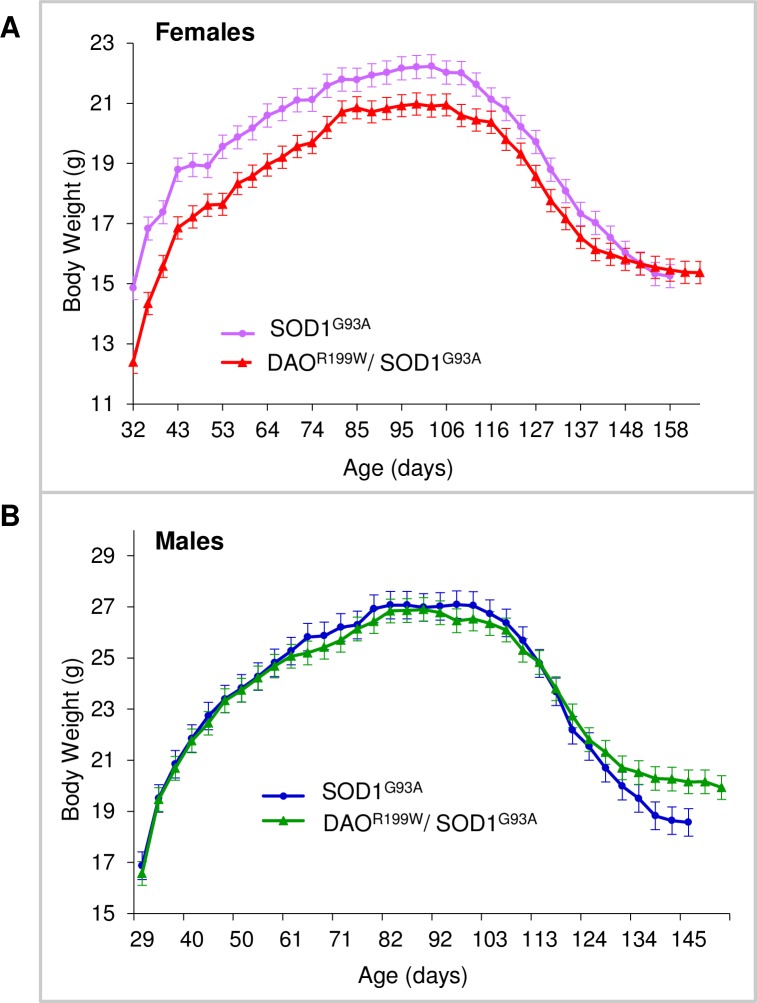
Fig 4. Longitudinal assessment of body weight in female SOD1G93A and double transgenic (SOD1G93A/DAOR199W) littermates.
Mean group body weight plotted for SOD1G93A and double transgenic (SOD1G93A/DAOR199W) mice over time from approximately 30 days of age until all the animals within a group reached the end stage and the study was terminated (n ≥ 14 per experimental group). As mice within groups died at different ages, in order to avoid decomposition of the mean at later stages, the final weights of all mice were carried forward when calculating group mean values, until the date at which the last mouse within each group died. Values are means with the standard error of the mean (SEM) indicated by error bars. (A) SOD1G93A females are presented in purple, and the double transgenic (SOD1G93A/DAOR199W) littermates are displayed in red. (B) SOD1G93A males are presented in blue, and the double transgenic (SOD1G93A/DAOR199W) littermates are displayed in green.

