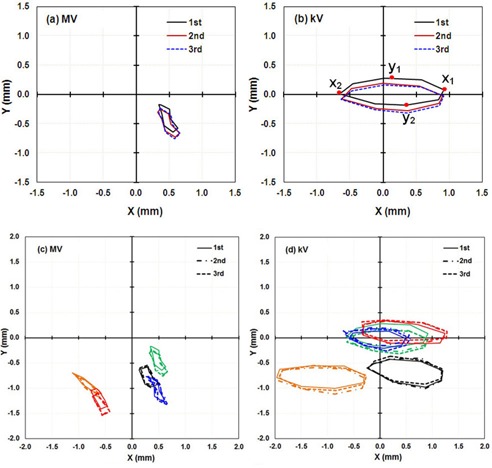
Figure 2.

IsoCal results for three independent calibrations in a row for five linacs: the lateral (X) and longitudinal (Y) offsets in a full gantry rotation between the MV ((a) to (c)) and kV imager centers ((b) and (d)) (the origin) and the projected treatment isocenter. , and are the points in each direction with the extreme values in that direction as illustrated in (b) (first curve); these extreme values were used as a metric of IsoCal reproducibility, as presented in Table 1. (a) and (b) are the results for linac M1, in (c) and (d): M1, Green, M2: Orange; M3: Red; M4: Black; M5: Blue.
Table 1.
| MV | kV | |||||||||||||||
|---|---|---|---|---|---|---|---|---|---|---|---|---|---|---|---|---|
|
|
|
|
|
|
|
|
|
|||||||||
| M1 | 0.0 | 0.1 | 0.2 | 0.1 | 0.0 | 0.0 | 0.2 | 0.2 | ||||||||
| M2 | 0.1 | 0.1 | 0.1 | 0.1 | 0.1 | 0.1 | 0.2 | 0.1 | ||||||||
| M3 | 0.1 | 0.1 | 0.2 | 0.1 | 0.0 | 0.1 | 0.1 | 0.0 | ||||||||
| M4 | 0.0 | 0.0 | 0.1 | 0.1 | ‐0.1 | 0.0 | 0.1 | 0.1 | ||||||||
| M5 | 0.1 | 0.1 | 0.1 | 0.1 | 0.2 | 0.2 | 0.2 | 0.1 | ||||||||
