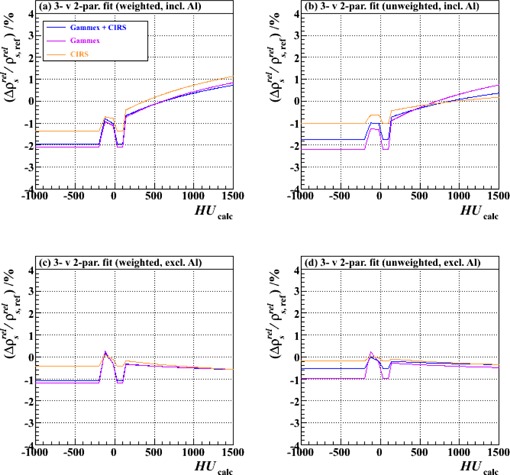
Figure 8.

Fractional differences in relative proton stopping power as a function of HU for stoichiometric calibrations carried out with three‐parameter fits compared to those carried out with two‐parameter fits. The results of using either the combined set of Gammex and CIRS plugs or one or other set alone are shown: (a) weighted fits, including also the Al plug (Tests 20, 16 and 18: a vs. b), (b) unweighted fits, including the Al plug (Tests 19, 15 and 17: a vs. b), (c) weighted fits, excluding the Al plug (Tests 14, 10 and 12: a vs. b), and (d) unweighted fits, excluding the Al plug (Tests 13, 1 and 11: a vs. b). “a vs. b” implies a comparison between data analyses performed for a particular test with either a three‐parameter fit (type “a” test, Table 2) or a two‐parameter fit (type “b” test, Table 2).
