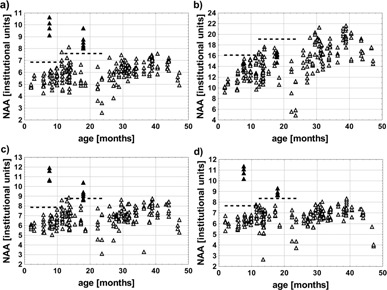
Figure 1.

Water‐scaled NAA levels obtained from short TE MRS in vivo spectra (a), water‐scaled NAA levels obtained from long TE MRS in vivo spectra (b), NAA levels determined based on absolute standard (before application of coefficient) from short TE MRS in vivo spectra (c), and NAA levels determined based on absolute standard (before application off coefficient) from long TE MRS in vivo spectra (d). Full triangles represent two cases diagnosed with Canavan disease, open triangles represent patients diagnosed with other neurological disorders, dashed lines indicate the threshold of ‘mean + 2 SD’ computed separately for patients aged 2‐12 months and 12‐24 months. The NAA concentrations were not corrected for relaxation and are expressed in institutional units.
