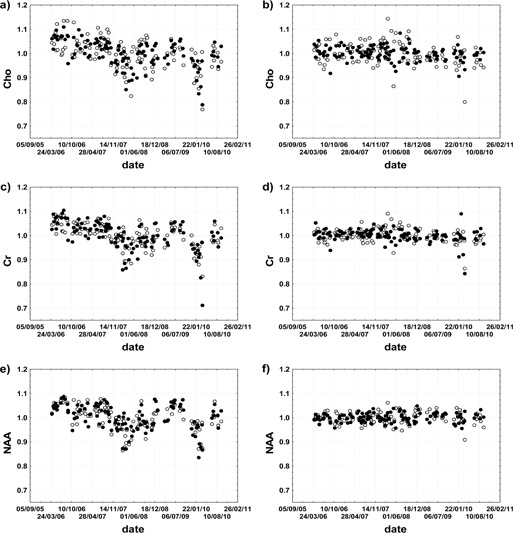
Figure 2.

Temporal variability of metabolite levels obtained from MRS in vitro measurements: Cho (a), Cr (c), and NAA (e) in vitro levels corrected for TG, R1, and R2; and Cho (b), Cr (d), and NAA (f) in vitro levels obtained using a water‐scaling technique. Dots represent short TE data, while circles represent long TE data. The metabolite levels are expressed relative to their mean levels in the period from April 2006 to September 2010.
