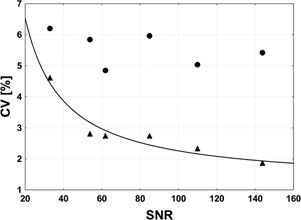
Figure 3.

Relationship between CV and SNR for NAA, Cho, and Cr in vitro levels. Dots represent data corrected for TG, R1, and R2 and triangles represent data obtained using water‐scaling technique. Both short and long TE in vitro data are included (Table 1). Statistically significant relationship was found between CV and SNR in water‐scaling technique.
