Figure 1.

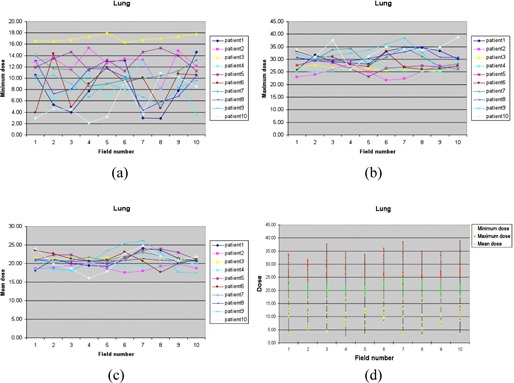
The minimum dose (a), maximum dose (b), and mean dose (c) of the PTV of each gantry angle/field for ten lung cases, and the distribution (d) of the minimum dose, maximum dose, and mean dose (unit: cGy).

The minimum dose (a), maximum dose (b), and mean dose (c) of the PTV of each gantry angle/field for ten lung cases, and the distribution (d) of the minimum dose, maximum dose, and mean dose (unit: cGy).