
Figure 3.
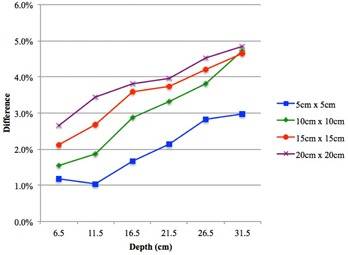
Percentage difference in central axis exit doses between Eclipse AAA and IC measured as a function of depth for different field sizes ( to ). Eclipse AAA computed doses were higher than IC measured doses at the exit level (only Eclipse AAA is shown).