
Figure 4.
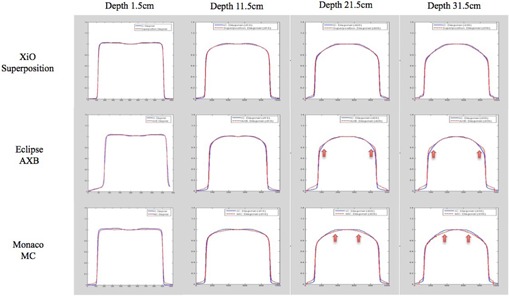
Diagonal relative profiles comparison between TPS computed (red dashed line) and IC measured (blue solid line) at depths 1.5 cm to 31.5 cm and field size . The arrows show areas of mismatch.
Official websites use .gov
A
.gov website belongs to an official
government organization in the United States.
Secure .gov websites use HTTPS
A lock (
) or https:// means you've safely
connected to the .gov website. Share sensitive
information only on official, secure websites.
Diagonal relative profiles comparison between TPS computed (red dashed line) and IC measured (blue solid line) at depths 1.5 cm to 31.5 cm and field size . The arrows show areas of mismatch.